

A new model for force generation by skeletal muscle, incorporating work-dependent deactivation
- PMID: 20118315
- PMCID: PMC2813793
- DOI: 10.1242/jeb.037598
A new model for force generation by skeletal muscle, incorporating work-dependent deactivation
Abstract
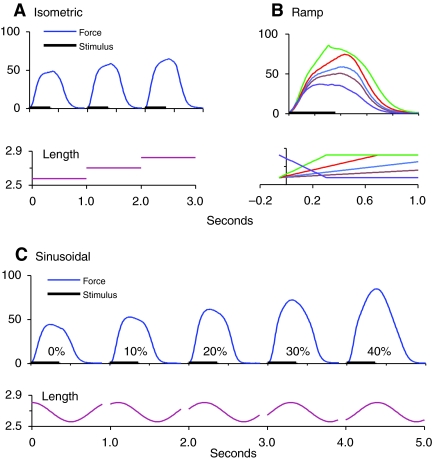
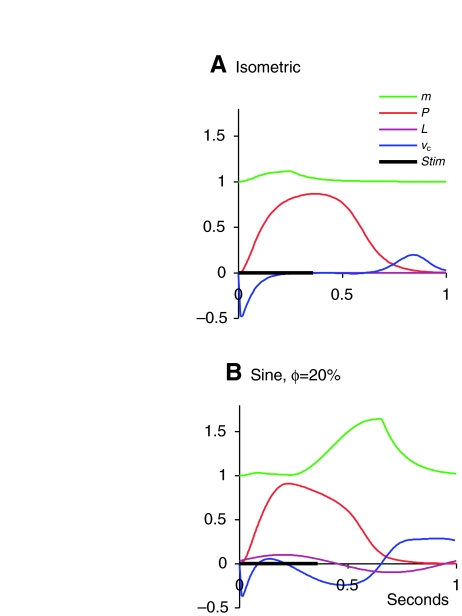
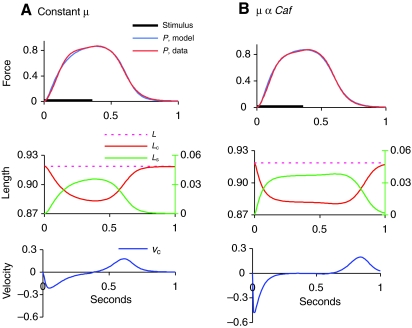
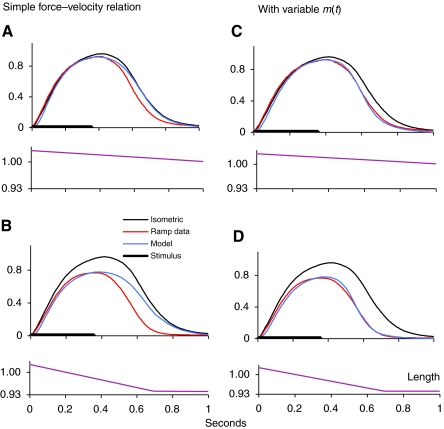
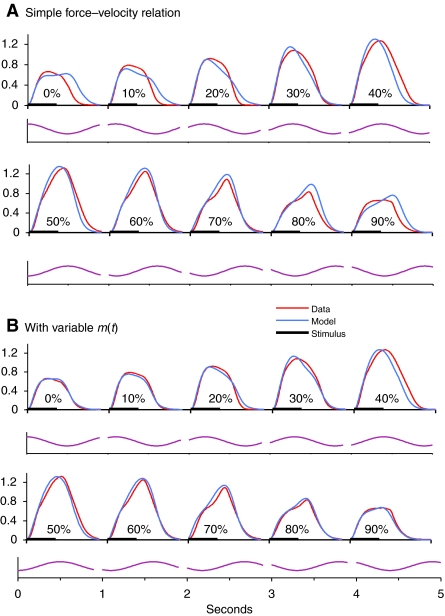
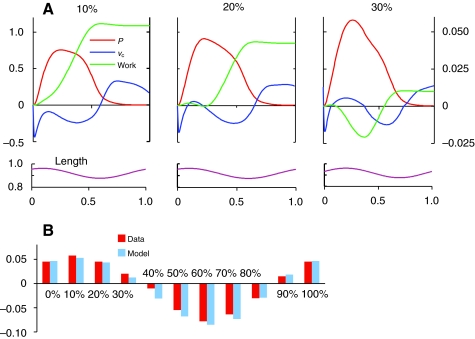
A model is developed to predict the force generated by active skeletal muscle when subjected to imposed patterns of lengthening and shortening, such as those that occur during normal movements. The model is based on data from isolated lamprey muscle and can predict the forces developed during swimming. The model consists of a set of ordinary differential equations, which are solved numerically. The model's first part is a simplified description of the kinetics of Ca(2+) release from sarcoplasmic reticulum and binding to muscle protein filaments, in response to neural activation. The second part is based on A. V. Hill's mechanical model of muscle, consisting of elastic and contractile elements in series, the latter obeying known physiological properties. The parameters of the model are determined by fitting the appropriate mathematical solutions to data recorded from isolated lamprey muscle activated under conditions of constant length or rate of change of length. The model is then used to predict the forces developed under conditions of applied sinusoidal length changes, and the results compared with corresponding data. The most significant advance of this model is the incorporation of work-dependent deactivation, whereby a muscle that has been shortening under load generates less force after the shortening ceases than otherwise expected. In addition, the stiffness in this model is not constant but increases with increasing activation. The model yields a closer prediction to data than has been obtained before, and can thus prove an important component of investigations of the neural-mechanical-environmental interactions that occur during natural movements.
Figures
Similar articles
-
Interactions between internal forces, body stiffness, and fluid environment in a neuromechanical model of lamprey swimming.Proc Natl Acad Sci U S A. 2010 Nov 16;107(46):19832-7. doi: 10.1073/pnas.1011564107. Epub 2010 Oct 29. Proc Natl Acad Sci U S A. 2010. PMID: 21037110 Free PMC article.
-
Body stiffness and damping depend sensitively on the timing of muscle activation in lampreys.Integr Comp Biol. 2018 Nov 1;58(5):860-873. doi: 10.1093/icb/icy042. Integr Comp Biol. 2018. PMID: 29873726
-
The effect of intrinsic muscular nonlinearities on the energetics of locomotion in a computational model of an anguilliform swimmer.J Theor Biol. 2015 Nov 21;385:119-29. doi: 10.1016/j.jtbi.2015.08.023. Epub 2015 Sep 9. J Theor Biol. 2015. PMID: 26362101
-
Biomechanical behavior of muscle-tendon complex during dynamic human movements.J Appl Biomech. 2006 May;22(2):131-47. doi: 10.1123/jab.22.2.131. J Appl Biomech. 2006. PMID: 16871004 Review.
-
Shortening deactivation of cardiac muscle: physiological mechanisms and clinical implications.J Investig Med. 1999 Sep;47(8):369-77. J Investig Med. 1999. PMID: 10510589 Review.
Cited by
-
Strategies for swimming: explorations of the behaviour of a neuro-musculo-mechanical model of the lamprey.Biol Open. 2015 Feb 6;4(3):253-8. doi: 10.1242/bio.20149621. Biol Open. 2015. PMID: 25661866 Free PMC article.
-
A phenomenological muscle model to assess history dependent effects in human movement.J Biomech. 2013 Jan 4;46(1):151-7. doi: 10.1016/j.jbiomech.2012.10.034. Epub 2012 Nov 21. J Biomech. 2013. PMID: 23178037 Free PMC article.
-
Proprioceptive feedback amplification restores effective locomotion in a neuromechanical model of lampreys with spinal injuries.Proc Natl Acad Sci U S A. 2023 Mar 14;120(11):e2213302120. doi: 10.1073/pnas.2213302120. Epub 2023 Mar 10. Proc Natl Acad Sci U S A. 2023. PMID: 36897980 Free PMC article.
-
Interactions between internal forces, body stiffness, and fluid environment in a neuromechanical model of lamprey swimming.Proc Natl Acad Sci U S A. 2010 Nov 16;107(46):19832-7. doi: 10.1073/pnas.1011564107. Epub 2010 Oct 29. Proc Natl Acad Sci U S A. 2010. PMID: 21037110 Free PMC article.
-
Mechanisms underlying rhythmic locomotion: dynamics of muscle activation.J Exp Biol. 2011 Jun 1;214(Pt 11):1955-64. doi: 10.1242/jeb.052787. J Exp Biol. 2011. PMID: 21562183 Free PMC article.
References
-
- Altringham J. D., Ellerby D. J. (1999). Fish swimming: patterns in muscle function. J. Exp. Biol. 202, 3397-3403 - PubMed
-
- Corr D. T., Herzog W. (2005). Force recovery after activated shortening in whole skeletal muscle: transient and steady-state aspects of force depression. J. Appl. Physiol. 99, 252-260 - PubMed
-
- Curtin N. A., Gardner-Medwin A. R., Woledge R. C. (1998). Predictions of the time course of force and power output by dogfish white muscle fibres during brief tetani. J. Exp. Biol. 201, 103-114 - PubMed
Publication types
MeSH terms
Substances
Grants and funding
LinkOut - more resources
Full Text Sources
Miscellaneous
