. 2010 Feb;28(2):149-56.
doi: 10.1038/nbt.1603. Epub 2010 Jan 31.

Rational association of genes with traits using a genome-scale gene network for Arabidopsis thaliana

Affiliations

Rational association of genes with traits using a genome-scale gene network for Arabidopsis thaliana

Insuk Lee et al. Nat Biotechnol. 2010 Feb.

Abstract

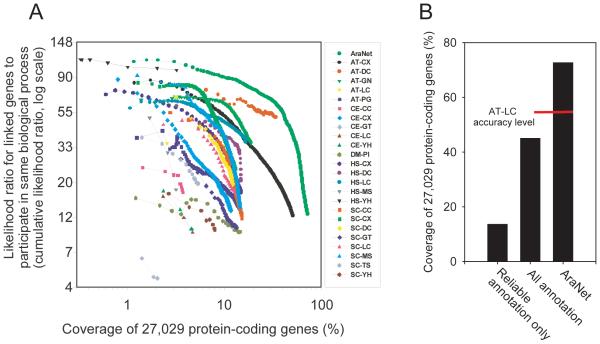
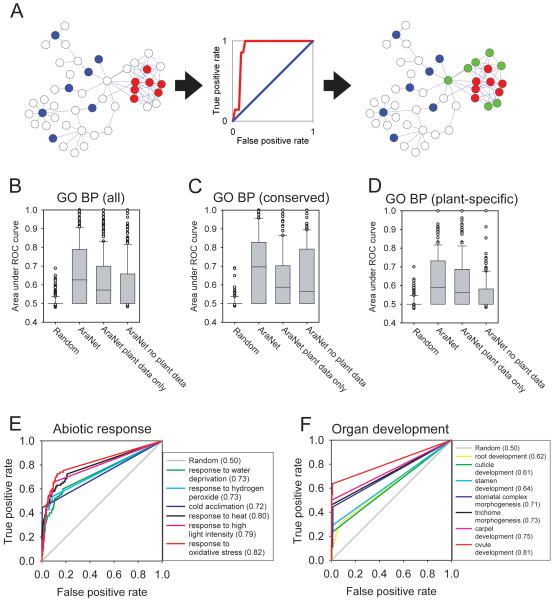
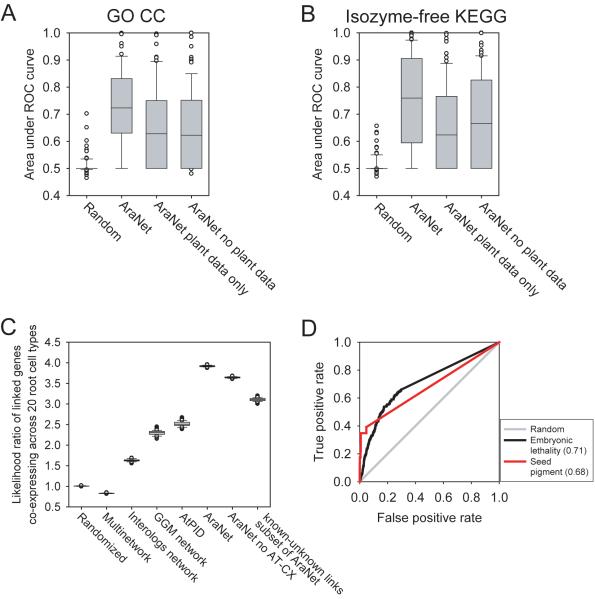
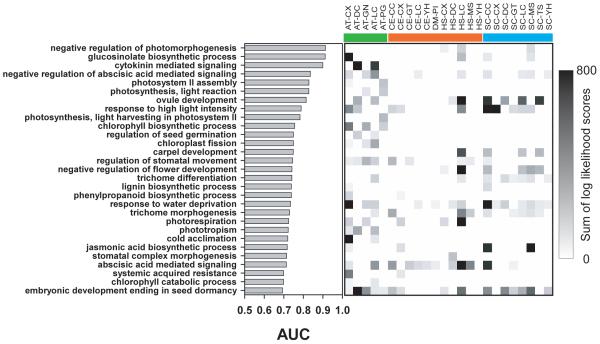
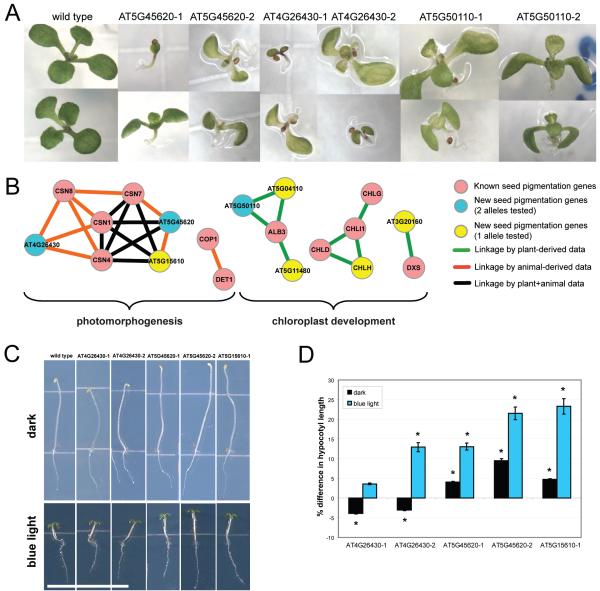
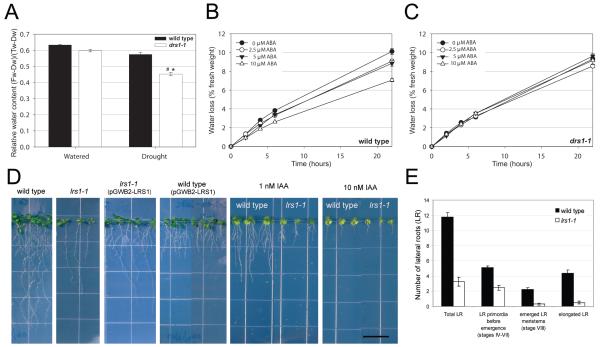
We introduce a rational approach for associating genes with plant traits by combined use of a genome-scale functional network and targeted reverse genetic screening. We present a probabilistic network (AraNet) of functional associations among 19,647 (73%) genes of the reference flowering plant Arabidopsis thaliana. AraNet associations are predictive for diverse biological pathways, and outperform predictions derived only from literature-based protein interactions, achieving 21% precision for 55% of genes. AraNet prioritizes genes for limited-scale functional screening, resulting in a hit-rate tenfold greater than screens of random insertional mutants, when applied to early seedling development as a test case. By interrogating network neighborhoods, we identify AT1G80710 (now DROUGHT SENSITIVE 1; DRS1) and AT3G05090 (now LATERAL ROOT STIMULATOR 1; LRS1) as regulators of drought sensitivity and lateral root development, respectively. AraNet (http://www.functionalnet.org/aranet/) provides a resource for plant gene function identification and genetic dissection of plant traits.


Figures

Figure 1
Figure 1
Construction, accuracy, and coverage of AraNet, a functional gene network for Arabidopsis thaliana. (A) Pairwise gene linkages derived from 24 diverse functional genomics and proteomics data sets, representing >50 million experimental or computational observations, were integrated into a composite network with higher accuracy and genome coverage than any individual data set. The integrated network (AraNet) contains 1,062,222 functional linkages among 19,647 (73%) of the 27,029 protein-coding A. thaliana genes. The plot x axis indicates the log-scale percentage of the 27,029 protein-coding genes covered by functional linkages derived from the indicated datasets (curves); the y axis indicates predictive quality of the datasets, measured as the cumulative likelihood ratio of linked genes to share Gene Ontology (GO) ‘biological process’ term annotations, tested using 0.632 bootstrapping and plotted for successive bins of 1,000 linkages each (symbols). Datasets are named as XX-YY, where XX indicates species of data origin (AT, A. thaliana; CE, C. elegans; DM, D. melanogaster; HS, H. sapiens; SC, S. cerevisiae) and YY indicates data type (CC, co-citation; CX, mRNA co-expression; DC, domain co-occurrence; GN, gene neighbor; GT, genetic interaction; LC, literature curated protein interactions; MS, affinity purification/mass spectrometry; PG, phylogenetic profiles; PI, fly protein interactions; TS, tertiary structure; YH, yeast two-hybrid. (B) AraNet spans ~73% of the protein-coding genes, far in excess of current GO biological process annotations for A. thaliana, for which ~12.2 % of genes are annotated by reliable experimental evidence (GO evidence codes IDA, IMP, IGI, IPI) or traceable author statements (GO evidence code TAS), or ~45% annotated by any evidence including computational inferences or sequence homology. The subset of AraNet linkages stronger than the likelihood ratio for literature-curated protein interactions (AT-LC, corresponding to a likelihood ratio of 35:1) covers 55% of the genes.
Figure 2
Figure 2
Predictive power of AraNet for conserved and plant-specific biological processes. AraNet’s predictive capacity was measured using cross-validated receiver operator characteristic (ROC) curve analysis, as illustrated in (A). For a given process, each gene in the A. thaliana genome is rank-ordered by the sum of its network linkage scores to the set of ‘bait’ genes already associated with that process (omitting each bait gene from the bait set for purposes of evaluation). High-scoring genes are most tightly connected to the bait set and are the most likely new candidates to participate in that process. This trend is evident in a ROC plot measuring recovery of bait genes as a function of rank, calculating the true-positive prediction rate (sensitivity; TP/(TP+FN)) versus the false-positive prediction rate (1–specificity; FP/(FP+TN)). If bait genes are highly interconnected (red circles), unlike random genes (blue circles), additional genes connected to the bait genes (green circles) are more likely to be involved in the same process. The area under the cross-validated ROC curve (AUC) provides a measure of predictability, ranging from ~0.5 for random expectation (blue curve) to 1 for perfect predictions (red curve). (B) Distributions of AUC values are plotted for network-based identification of genes for each of the 318 Gene Ontology biological process terms with annotations, (C) for each of the 151 biological process terms with annotations shared between plant and animal or between plant and yeast, and (D) for each of the 167 biological process terms with annotations found in plants but absent from animals and fungi. In all cases, AraNet performs significantly better than for random gene sets of the same sizes. AraNet showed strong predictive power, even when using only Arabidopsis-derived links, although addition of non-plant datasets significantly boosted performance. In bar-and-whiskers plots, the central horizontal line in the box indicates the median AUC and the boundaries of the box indicate the first and third quartiles of the AUC distribution. AraNet specifically identified genes associated with (E) plant abiotic stress response genes and (F) organ developmental processes, as annotated by GO.
Figure 3
Figure 3
Validation of AraNet by independent datasets. AraNet shows strong predictive power for gene annotation sets independent of those used to construct AraNet, plotting predictability for (A) 86 GO cellular component terms, and (B) 82 KEGG metabolic pathways (excluding isozymes). The capacity for making association between genes and cell- and tissue-specific biological processes likely arises from the strong tendency for linked genes to share spatiotemporal expression patterns. This tendency is apparent in (C), in which the co-occurrence of mRNA transcripts across 20 root cell-types is significantly greater for network-linked genes than for randomized gene pairs (calculated as in the Supplementary Information). Moreover, this tendency is stronger in AraNet than those in previous, smaller gene networks (Supplementary Table 3)-. Genes linked in AraNet were significantly more co-expressed in each root cell-type than gene pairs from random networks (repeating the calculation for 100 randomized networks and plotting the distribution of the 100 resulting odds ratios), with >400% enrichment over random for cell type-specific co-expression across the 20 root cell types in AraNet. This trend cannot be explained simply by the incorporation of Arabidopsis mRNA expression data into AraNet, as a version of the network lacking this data shows similarly high cell-type specificity. (D) AraNet shows predictability for genes affecting embryonic lethality or changes in seed pigmentation, as identified in the SeedGenes database. AUC values are indicated in parentheses.
Figure 4
Figure 4
AraNet correctly associates genes with many processes unique to plants, nonetheless relying at least in part on data from animals and yeast, which contribute evidence for linkages among genes that are broadly conserved but whose roles in Arabidopsis are in plant-specific processes. The performance at associating genes with each of 29 biological processes specific to plants (annotated only with plant genes in GO and are known to occur only in plants) is summarized as the area under a cross-validated ROC curve (AUC). Even though these processes are absent in animals or fungi, the associated genes often have orthologs in these taxa, and AraNet draws upon data from these orthologs in making the associations. Each gray square demarks the support provided by a dataset, measured as a sum of log likelihood scores contributing to that process, with darker gray indicating higher support. Datasets are labeled as in Figure 1.
Figure 5
Figure 5
Discovery of new seed (embryo) pigmentation defective genes predicted by AraNet guilt-by-association. (A) Seedling pigmentation defects are apparent in each of two independent alleles for the genes AT5G45620, AT4G26430 (CSN6B), and AT5G50110, all predicted based on network connections to known pigmentation defect genes. (B) Eight new seed pigmentation defective genes are organized into five network components by connections to known seed pigmentation genes, with evidence for the connections coming both from plant- and animal-derived datasets. (C) Mutants linked to known CSN genes show longer hypocotyl length than wild type in dark and under blue light, except CSN6B mutants, which show slightly shorter hypocotyls in dark. Scale bar = 1.3 cm. (D) Most of the differences in hypocotyl length of these mutants are slight (5-25%) but significant. Significant differences from wild type are indicated by asterisks (p-value < 0.01, paired t-test, n = 26 (dark), 32 (blue light)). n indicates the number of plates, each plate containing 7-8 plants of wild type and mutant genotype. Results are from seven (dark) or eight (blue light) independent experiments.
Figure 6
Figure 6
Discovery of new regulators of drought sensitivity and lateral root development from previously uncharacterized genes using AraNet. (A) Plants carrying a T-DNA insertion (drs1-1) in a previously uncharacterized gene, At1g80710, retained significantly less water than wild type under drought. Relative water loss was calculated as (Fw-Dw)/(Tw-Dw) (Fw, fresh weight; Dw, dry weight; Tw, turgor weight). Significant differences between the relative water loss of wild type and mutant plants are indicated by * (p ≤ 0.001, unpaired t-test, n = 15), significant differences between watered and drought conditions of the same genotype by # (p ≤ 0.0001, unpaired t-test, n = 15). (B-C) Transpiration was reduced in wild type plants in the presence of abscisic acid (ABA) in a dosage dependent manner (B) whereas mutant plants were insensitive to ABA (C). (D) The number of lateral roots is strongly reduced in lines carrying a T-DNA insertion (lrs1-1) in another previously uncharacterized gene At3g05090. This phenotype can be complemented by reintroduction of the functional gene. When additional copies of the gene are expressed in a wild type strain, lateral roots increase, while the primary root decreases, in length. 1 nM Auxin (IAA) increases the number and length of lateral roots in both the wild type and mutant seedlings. Contrarily, 10 nM IAA severely reduces the primary root length in both genotypes. Scale bar = 1.4 cm. (E) Different stages of the lateral root (LR) formation are affected in the lrs1-1 mutant. Wild type lateral roots are distributed fairly evenly among LR primordia, emerged LR and elongated LR. The mutant has reduced numbers of the LR in all of these stages, though the reduction is more severe in the emerged and elongated LR than that in the LR primordia. Error bars indicate standard error.

References

    1. Alonso JM, et al. Genome-wide insertional mutagenesis of Arabidopsis thaliana. Science (New York, N.Y. 2003;301:653–657. - PubMed
    1. Marcotte EM, Pellegrini M, Thompson MJ, Yeates TO, Eisenberg D. A combined algorithm for genome-wide prediction of protein function. Nature. 1999;402:83–86. - PubMed
    1. McGary KL, Lee I, Marcotte EM. Broad network-based predictability of Saccharomyces cerevisiae gene loss-of-function phenotypes. Genome Biol. 2007;8:R258. - PMC - PubMed
    1. Fraser HB, Plotkin JB. Using protein complexes to predict phenotypic effects of gene mutation. Genome Biol. 2007;8:R252. - PMC - PubMed
    1. Lee I, et al. A single gene network accurately predicts phenotypic effects of gene perturbation in Caenorhabditis elegans. Nature genetics. 2008;40:181–188. - PubMed

Publication types

MeSH terms

Substances