

Signaling by intrathymic cytokines, not T cell antigen receptors, specifies CD8 lineage choice and promotes the differentiation of cytotoxic-lineage T cells
- PMID: 20118929
- PMCID: PMC3555225
- DOI: 10.1038/ni.1840
Signaling by intrathymic cytokines, not T cell antigen receptors, specifies CD8 lineage choice and promotes the differentiation of cytotoxic-lineage T cells
Abstract
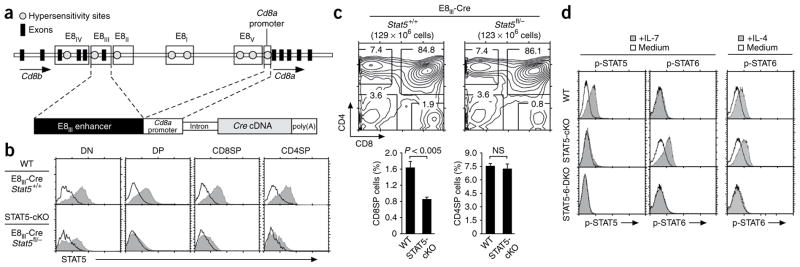
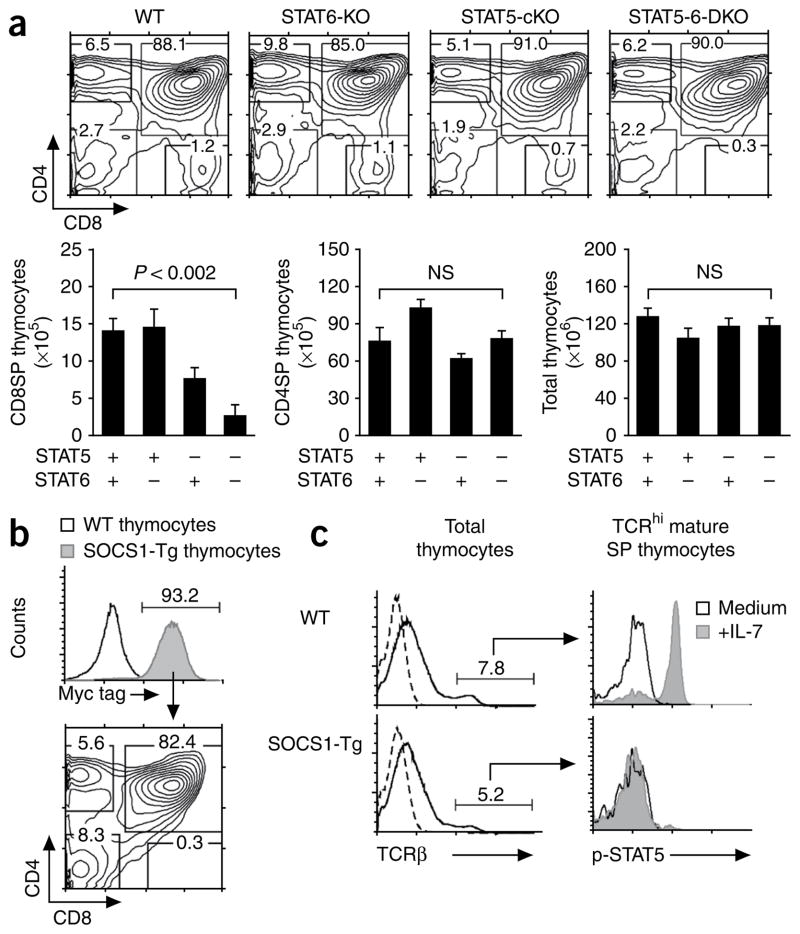
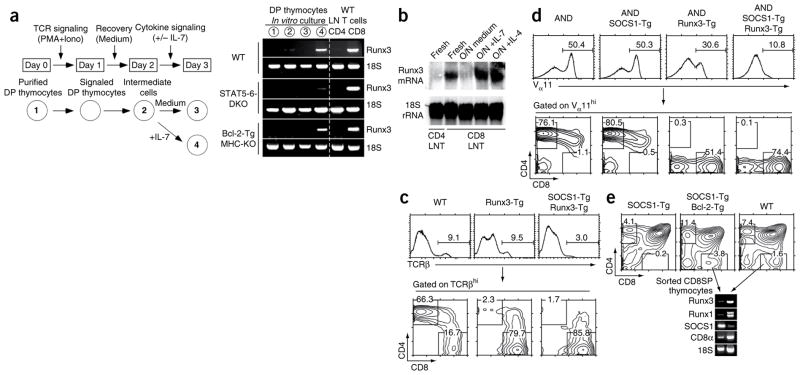
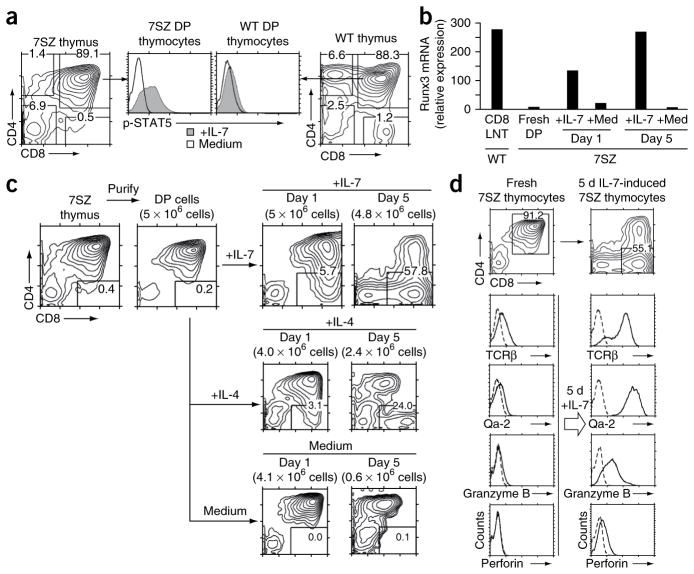
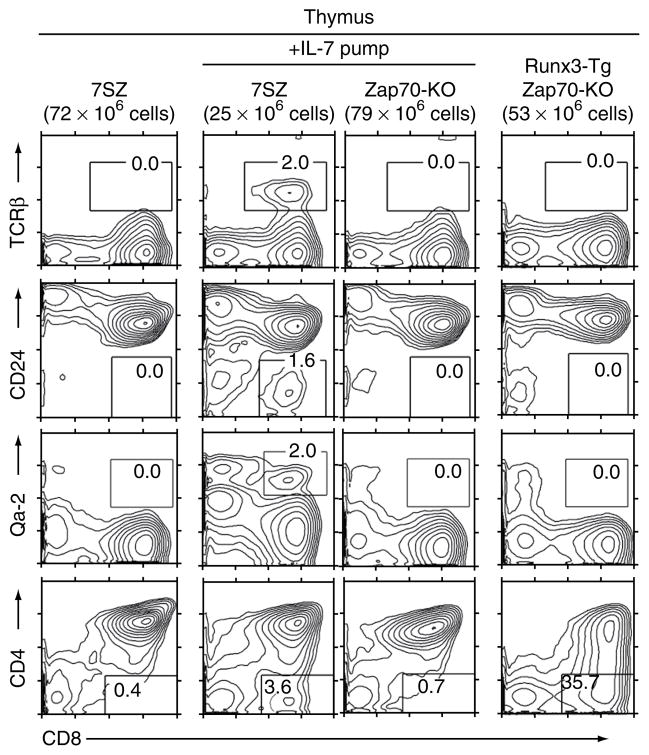
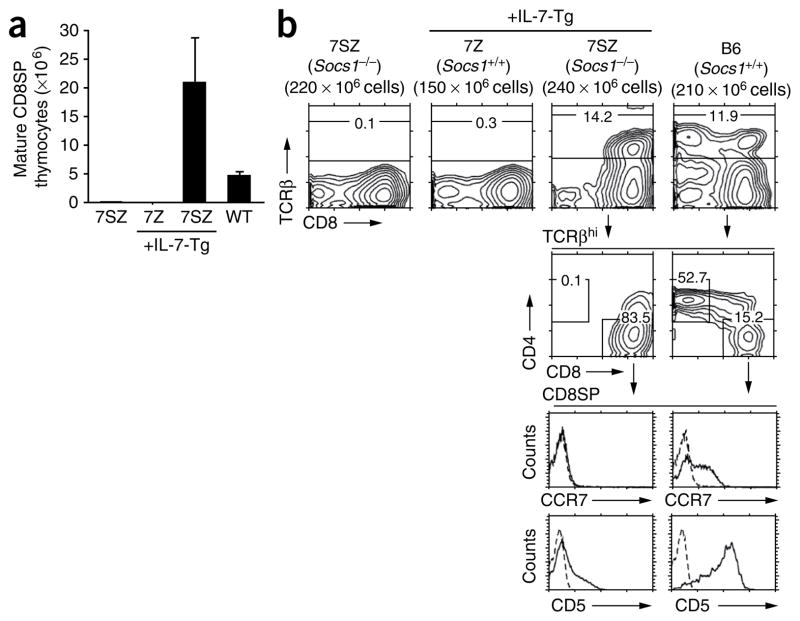
Immature CD4(+)CD8(+) (double-positive (DP)) thymocytes are signaled via T cell antigen receptors (TCRs) to undergo positive selection and become responsive to intrathymic cytokines such as interleukin 7 (IL-7). We report here that cytokine signaling is required for positively selected thymocytes to express the transcription factor Runx3, specify CD8 lineage choice and differentiate into cytotoxic-lineage T cells. In DP thymocytes genetically engineered to be cytokine responsive, IL-7 signaling induced TCR-unsignaled DP thymocytes to express Runx3 and to differentiate into mature CD8(+) T cells, completely circumventing positive selection. We conclude that TCR-mediated positive selection converts DP cells into cytokine-responsive thymocytes, but it is subsequent signaling by intrathymic cytokines that specifies CD8 lineage choice and promotes differentiation into cytotoxic-lineage T cells.
Conflict of interest statement
The authors declare no competing financial interests.
Figures
Comment in
-
CD8+ thymocyte differentiation: T cell two-step.Nat Immunol. 2010 Mar;11(3):189-90. doi: 10.1038/ni0310-189. Nat Immunol. 2010. PMID: 20157298 No abstract available.
Similar articles
-
Analyzing expression of perforin, Runx3, and Thpok genes during positive selection reveals activation of CD8-differentiation programs by MHC II-signaled thymocytes.J Immunol. 2005 Oct 1;175(7):4465-74. doi: 10.4049/jimmunol.175.7.4465. J Immunol. 2005. PMID: 16177089
-
Identification of lineage-specifying cytokines that signal all CD8+-cytotoxic-lineage-fate 'decisions' in the thymus.Nat Immunol. 2017 Nov;18(11):1218-1227. doi: 10.1038/ni.3847. Epub 2017 Sep 25. Nat Immunol. 2017. PMID: 28945245 Free PMC article.
-
Conditional deletion of cytokine receptor chains reveals that IL-7 and IL-15 specify CD8 cytotoxic lineage fate in the thymus.J Exp Med. 2012 Nov 19;209(12):2263-76. doi: 10.1084/jem.20121505. Epub 2012 Oct 29. J Exp Med. 2012. PMID: 23109710 Free PMC article.
-
Lineage fate and intense debate: myths, models and mechanisms of CD4- versus CD8-lineage choice.Nat Rev Immunol. 2008 Oct;8(10):788-801. doi: 10.1038/nri2416. Nat Rev Immunol. 2008. PMID: 18802443 Free PMC article. Review.
-
CD4 Helper and CD8 Cytotoxic T Cell Differentiation.Annu Rev Immunol. 2018 Apr 26;36:579-601. doi: 10.1146/annurev-immunol-042617-053411. Annu Rev Immunol. 2018. PMID: 29677476 Review.
Cited by
-
Changing course by lymphocyte lineage redirection.Nat Immunol. 2013 Mar;14(3):199-201. doi: 10.1038/ni.2544. Nat Immunol. 2013. PMID: 23416670 No abstract available.
-
Transcriptional activation of prostate specific homeobox gene NKX3-1 in subsets of T-cell lymphoblastic leukemia (T-ALL).PLoS One. 2012;7(7):e40747. doi: 10.1371/journal.pone.0040747. Epub 2012 Jul 27. PLoS One. 2012. PMID: 22848398 Free PMC article.
-
CD8 lineage-specific regulation of interleukin-7 receptor expression by the transcriptional repressor Gfi1.J Biol Chem. 2012 Oct 5;287(41):34386-99. doi: 10.1074/jbc.M112.378687. Epub 2012 Aug 3. J Biol Chem. 2012. PMID: 22865857 Free PMC article.
-
CD8+ thymocyte differentiation: T cell two-step.Nat Immunol. 2010 Mar;11(3):189-90. doi: 10.1038/ni0310-189. Nat Immunol. 2010. PMID: 20157298 No abstract available.
-
T cells in health and disease.Signal Transduct Target Ther. 2023 Jun 19;8(1):235. doi: 10.1038/s41392-023-01471-y. Signal Transduct Target Ther. 2023. PMID: 37332039 Free PMC article. Review.
References
-
- Jameson SC, Hogquist KA, Bevan MJ. Positive selection of thymocytes. Annu Rev Immunol. 1995;13:93–126. - PubMed
-
- Singer A. New perspectives on a developmental dilemma: the kinetic signaling model and the importance of signal duration for the CD4/CD8 lineage decision. Curr Opin Immunol. 2002;14:207–215. - PubMed
-
- Surh CD, Sprent J. T-cell apoptosis detected in situ during positive and negative selection in the thymus. Nature. 1994;372:100–103. - PubMed
-
- Van De Wiele CJ, et al. Thymocytes between the β-selection and positive selection checkpoints are nonresponsive to IL-7 as assessed by STAT-5 phosphorylation. J Immunol. 2004;172:4235–4244. - PubMed
Publication types
MeSH terms
Substances
Grants and funding
LinkOut - more resources
Full Text Sources
Other Literature Sources
Molecular Biology Databases
Research Materials
