. 2009 Aug;3(4):265-72.
doi: 10.2976/1.3086732. Epub 2009 Mar 20.

Homeostatic competition drives tumor growth and metastasis nucleation

Homeostatic competition drives tumor growth and metastasis nucleation

Markus Basan et al. HFSP J. 2009 Aug.

Abstract

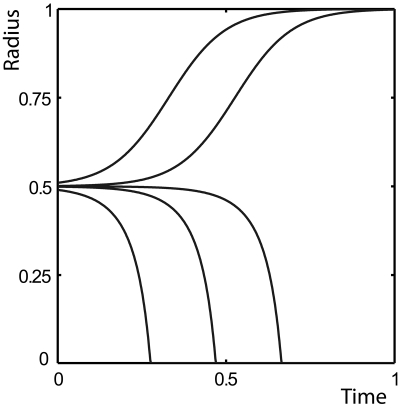
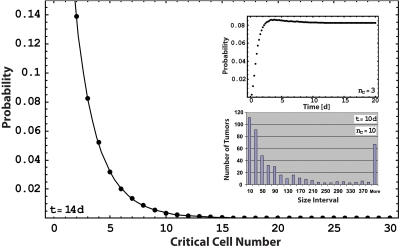
We propose a mechanism for tumor growth emphasizing the role of homeostatic regulation and tissue stability. We show that competition between surface and bulk effects leads to the existence of a critical size that must be overcome by metastases to reach macroscopic sizes. This property can qualitatively explain the observed size distributions of metastases, while size-independent growth rates cannot account for clinical and experimental data. In addition, it potentially explains the observed preferential growth of metastases on tissue surfaces and membranes such as the pleural and peritoneal layers, suggests a mechanism underlying the seed and soil hypothesis introduced by Stephen Paget in 1889, and yields realistic values for metastatic inefficiency. We propose a number of key experiments to test these concepts. The homeostatic pressure as introduced in this work could constitute a quantitative, experimentally accessible measure for the metastatic potential of early malignant growths.


Figures

Figure 1
Figure 1. (A) Schematic representation of a measurement apparatus for the homeostatic pressure.
As the tissue proliferates, the piston compresses the spring and the pressure exerted on the tissue increases. Once a steady state is reached, cell division and apoptosis balance. The cell density and the pressure exerted on the spring at this point define the homeostatic mechanical state of the tissue in a given biochemical environment. (B) Schematic representation of a tissue-competition experiment. The two tissues are in mechanical contact through a freely moving, impermeable piston. The tissue with the lower homeostatic pressure is compressed to a cell density above its homeostatic point and initiates apoptosis. The other tissue proliferates and expands until the opposing tissue has disappeared.
Figure 2
Figure 2. Numerical solution for the cell density (A) and cell velocity (B) as functions of space and time during the growth of one tissue located in the bulk of another tissue of lower homeostatic pressure.
Color coding for local cell density and velocity is given on the right hand side of panels (A) and (B), respectively. Spherical symmetry is assumed. Total integration time, compartment size, and homeostatic densities of tissues T and H are scaled to one. In both plots, the boundary between the two tissues is indicated by a black line. Parameters are chosen in order to illustrate the interplay between viscous dynamics and compartment growth (see Supplementary Material).
Figure 3
Figure 3. Numerical solution for the cell density (A) and cell velocity (B) as functions of space and time during the growth of a tissue engulfed in an elastic membrane and located in the bulk of another tissue of lower homeostatic pressure.
As in Fig. 2, spherical symmetry is assumed; total integration time, compartment size, and homeostatic densities are scaled to one, and in both plots the boundary between the two tissues is indicated by a black line. Color coding is similar to the one used in Fig. 2. In this solution, the membrane is treated as purely elastic and is put under tension above a given radius x0=0.5. The explicit surface tension dependence on the boundary location x is given in the Supplementary Material. Additional parameters are given in the Supplementary Material. (A) The expansion of the inner compartment is similar to that of Fig. 2 until, at x=0.5, surface tension begins to play a role. The membrane expands until its tension balances the pressure difference between the two compartments and a stable steady state is reached. (B) Corresponding cell-velocity plot.
Figure 4
Figure 4. Numerical solution of the growth dynamics with the geometrical arrangement of Fig. 2 when growth rates are nutrient limited.
Nutrients diffuse into the inner compartment through the tissue interface (see Supplementary Material). (A) The inner compartment starts growing as in the case of Fig. 2 but asymptotically reaches a maximum size. (B) Cells proliferate at the surface of the inner compartment, which is rich in nutrients, and die at the center where nutrients are scarce, resulting in an inward flow of cells. Color coding is similar to the one used in Figs. 23, but it now allows for negative values required by the inward flow.
Figure 5
Figure 5. Tissue boundary as a function of time during the growth of a tissue located in the bulk of another tissue of lower homeostatic pressure, with interfacial tension and in spherical geometry.
Parameters are given in the Supplementary Material, together with rc=0.5 and γ=1. The different curves show the dynamics for the following initial values r0 of r: 0.49, 0.499, 0.4999, 0.501, and 0.51. Both tissues start out at their homeostatic densities.
Figure 6
Figure 6. Splitting probability as a function of the critical cell number.
The black dots are the fraction of tumors with a size larger than the critical radius after 14 days of evolution, starting from a single cell in a Monte Carlo simulation [see Eqs. 5, 7]. The black line represents the analytic result for the splitting probability as given by Eq. 8. Parameters are chosen such that far above the critical radius, the division rate reaches a value of one division per day and the apoptosis rate is negligible. k0 in Eq. 7 is chosen to be 0.9 division per day. Note that the probability for growth on the compartment surface can be read out from the plot using half of the critical cell number of the process in the bulk. Upper inset: Fraction of tumors that are above the critical size. This fraction relaxes to a constant value in a Monte Carlo simulation. Lower inset: Distribution of tumor sizes in a Monte Carlo simulation after 10 days of evolution of 105 individual tumor cells.

References

    1. Cameron, M D, Schmidt, E E, Kerkvliet, N, Nadkarni, K V, Morris, V L, Groom, A C, Chambers, A F, and MacDonald, I C (2000). “Temporal progression of metastasis in lung: cell survival, dormancy, and location dependence of metastatic inefficiency: 1.” Cancer Res. CNREA8 60, 2541–2546. - PubMed
    1. Chambers, A F, Groom, A C, and MacDonald, I C (2002). “Dissemination and growth of cancer cells in metastatic sites.” Nat. Rev. Cancer NRCAC410.1038/nrc865 2, 563–572. - DOI - PubMed
    1. Chambers, A F, and Wilson, S (1988). “Use of Neo R B16F1 murine melanoma cells to assess clonality of experimental metastases in the immune-deficient chick embryo.” Clin. Exp. Metastasis ZZZZZZ 6, 171–182. - PubMed
    1. Chaplain, M A. J, Graziano, L, and Preziosi, L (2006). “Mathematical modelling of the loss of tissue compression responsiveness and its role in solid tumour development.” Math. Med. Biol. 23, 197–229. - PubMed
    1. Couzin, J (2003). “Tracing the steps of metastasis, cancer’s menacing ballet.” Science SCIEAS 299, 1002–1006. - PubMed

LinkOut - more resources