

Habitat-related birdsong divergence: a multi-level study on the influence of territory density and ambient noise in European blackbirds
- PMID: 20119488
- PMCID: PMC2810368
- DOI: 10.1007/s00265-009-0857-8
Habitat-related birdsong divergence: a multi-level study on the influence of territory density and ambient noise in European blackbirds
Abstract
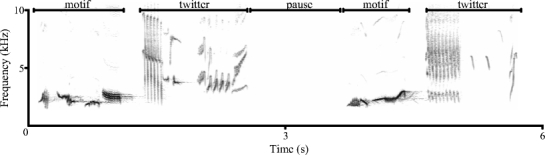
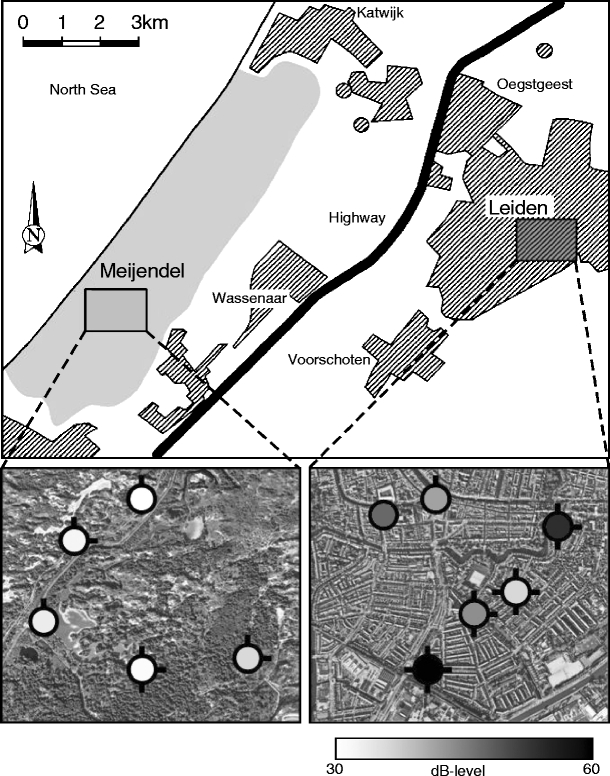
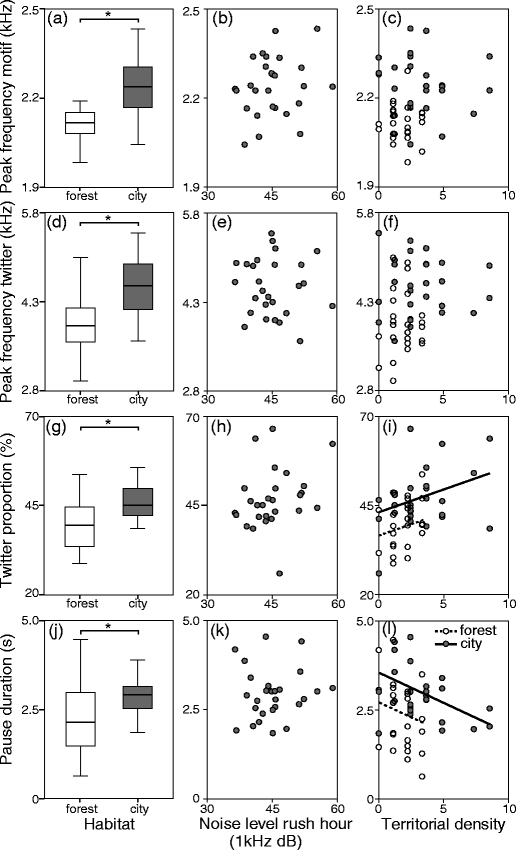
Song plays an important role in avian communication and acoustic variation is important at both the individual and population level. Habitat-related variation between populations in particular can reflect adaptations to the environment accumulated over generations, but this may not always be the case. In this study, we test whether variation between individuals matches local conditions with respect to noise level and territory density to examine whether short-term flexibility could contribute to song divergence at the population level. We conducted a case study on an urban and forest population of the European blackbird and show divergence at the population level (i.e. across habitats) in blackbird song, anthropogenic noise level and territory density. Unlike in several other species, we found a lack of any correlation at the individual level (i.e. across individuals) between song features and ambient noise. This suggests species-specific causal explanations for noise-dependent song differentiation which are likely associated with variation in song-copying behaviour or feedback constraints related to variable singing styles. On the other hand, we found that at the level of individual territories, temporal features, but not spectral ones, are correlated to territory density and seasonality. This suggests that short-term individual variation can indeed contribute to habitat-dependent divergence at the population level. As this may undermine the potential role for song as a population marker, we conclude that more investigations on individual song flexibility are required for a better understanding of the impact of population-level song divergence on hybridisation and speciation.
Figures
Similar articles
-
Sleepless in town--drivers of the temporal shift in dawn song in urban European blackbirds.PLoS One. 2013 Aug 7;8(8):e71476. doi: 10.1371/journal.pone.0071476. Print 2013. PLoS One. 2013. PMID: 23940759 Free PMC article.
-
Eastern Bluebirds Alter their Song in Response to Anthropogenic Changes in the Acoustic Environment.Integr Comp Biol. 2015 Sep;55(3):418-31. doi: 10.1093/icb/icv070. Epub 2015 Jun 26. Integr Comp Biol. 2015. PMID: 26116201
-
Seasonality and social factors, but not noise pollution, influence the song characteristics of two leaf warbler species.PLoS One. 2021 Sep 2;16(9):e0257074. doi: 10.1371/journal.pone.0257074. eCollection 2021. PLoS One. 2021. PMID: 34473797 Free PMC article.
-
Birdsong and anthropogenic noise: implications and applications for conservation.Mol Ecol. 2008 Jan;17(1):72-83. doi: 10.1111/j.1365-294X.2007.03487.x. Epub 2007 Sep 3. Mol Ecol. 2008. PMID: 17784917 Review.
-
Bird song, ecology and speciation.Philos Trans R Soc Lond B Biol Sci. 2002 Apr 29;357(1420):493-503. doi: 10.1098/rstb.2001.1056. Philos Trans R Soc Lond B Biol Sci. 2002. PMID: 12028787 Free PMC article. Review.
Cited by
-
Experimental evidence for real-time song frequency shift in response to urban noise in a passerine bird.Biol Lett. 2011 Feb 23;7(1):36-8. doi: 10.1098/rsbl.2010.0437. Epub 2010 Jul 7. Biol Lett. 2011. PMID: 20610421 Free PMC article.
-
Vocal frequency change reflects different responses to anthropogenic noise in two suboscine tyrant flycatchers.Proc Biol Sci. 2011 Jul 7;278(1714):2025-31. doi: 10.1098/rspb.2010.1847. Epub 2010 Dec 1. Proc Biol Sci. 2011. PMID: 21123268 Free PMC article.
-
Uncovering Spatial Variation in Acoustic Environments Using Sound Mapping.PLoS One. 2016 Jul 28;11(7):e0159883. doi: 10.1371/journal.pone.0159883. eCollection 2016. PLoS One. 2016. PMID: 27467503 Free PMC article.
-
Sleepless in town--drivers of the temporal shift in dawn song in urban European blackbirds.PLoS One. 2013 Aug 7;8(8):e71476. doi: 10.1371/journal.pone.0071476. Print 2013. PLoS One. 2013. PMID: 23940759 Free PMC article.
-
Learning to cope: vocal adjustment to urban noise is correlated with prior experience in black-capped chickadees.Proc Biol Sci. 2016 Jun 29;283(1833):20161058. doi: 10.1098/rspb.2016.1058. Proc Biol Sci. 2016. PMID: 27358372 Free PMC article.
References
-
- Brumm H. The impact of environmental noise on song amplitude in a territorial bird. J Anim Ecol. 2004;73:434–440. doi: 10.1111/j.0021-8790.2004.00814.x. - DOI
-
- Brumm H, Slabbekoorn H. Acoustic communication in noise. Adv Study Behav. 2005;35:151–209. doi: 10.1016/S0065-3454(05)35004-2. - DOI
-
- Capp MS, Searcy WA. An experimental-study of song type function in the bobolink (Dolichonyx oryzivorus) Behav Ecol Sociobiol. 1991;28:179–186. doi: 10.1007/BF00172169. - DOI
-
- Clement P, Hathway R. Helm identification guides: thrushes. London: Christopher Helm Ltd; 2000.
-
- Dabelsteen T. An analysis of the full song of the blackbird Turdus merula with respect to message coding and adaptations for acoustic communication. Ornis Scand. 1984;15:227–239. doi: 10.2307/3675931. - DOI
LinkOut - more resources
Full Text Sources
Research Materials