

Effects of point-loss punishers on human signal-detection performance
- PMID: 20119520
- PMCID: PMC2707137
- DOI: 10.1901/jeab.2009.92-17
Effects of point-loss punishers on human signal-detection performance
Abstract
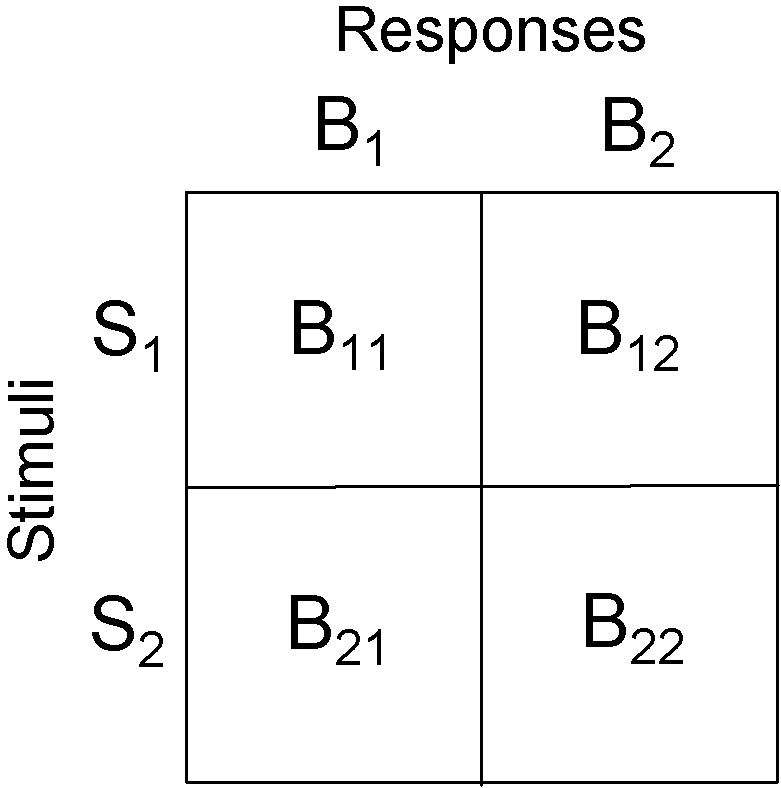
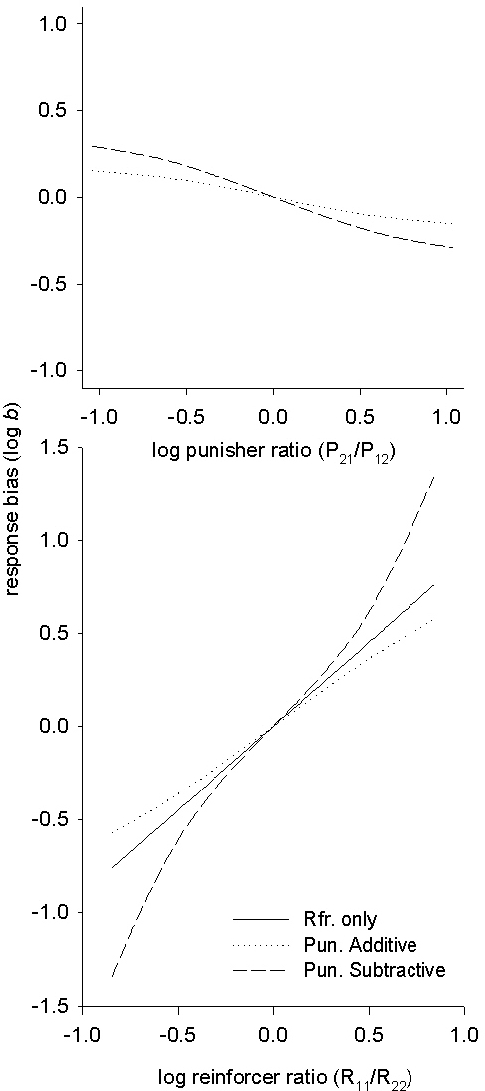
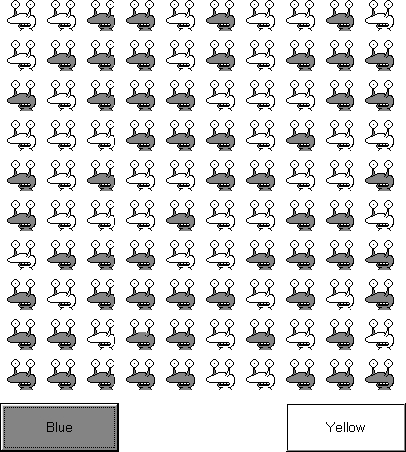
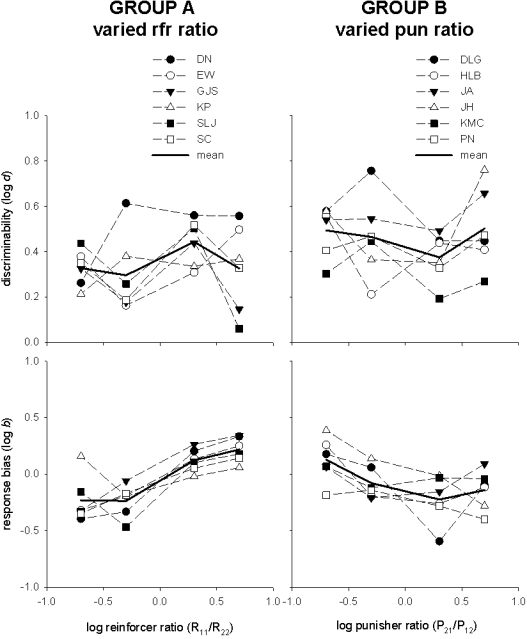
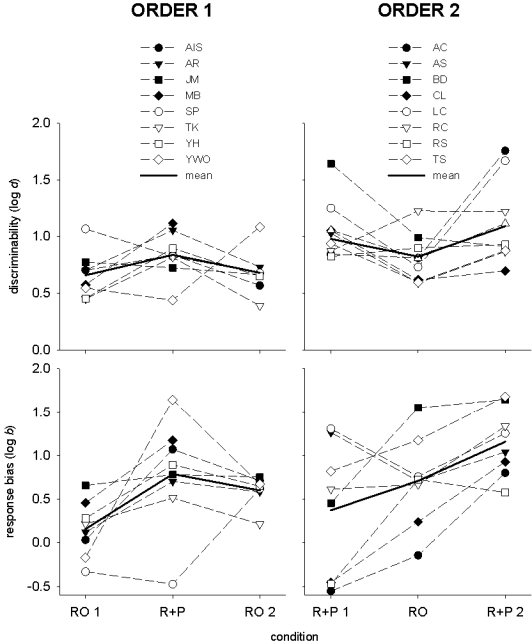
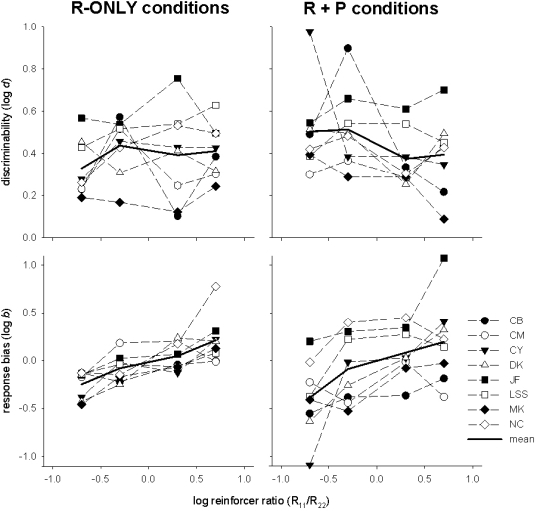
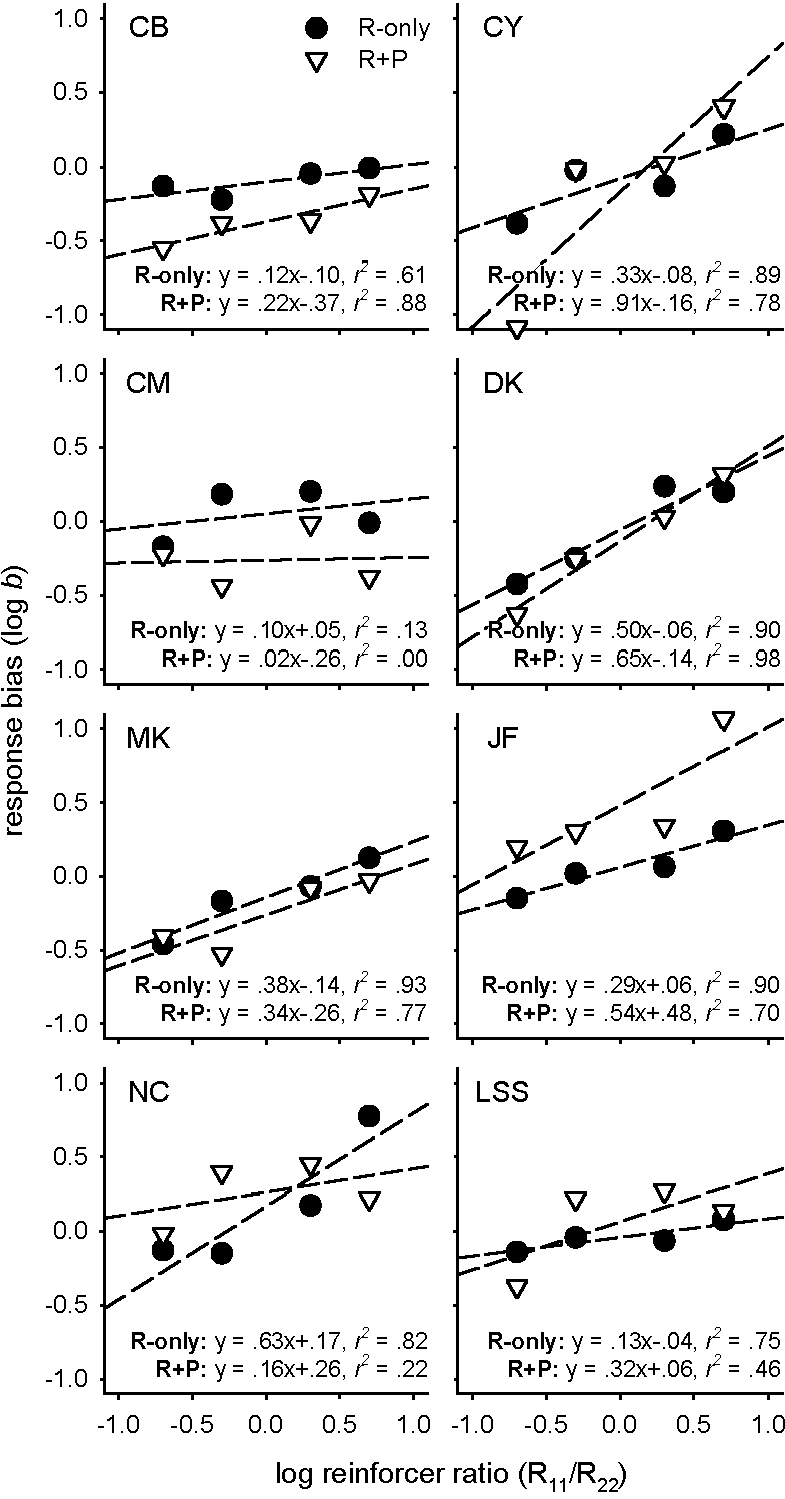
Three experiments using human participants varied the distribution of point-gain reinforcers or point-loss punishers in two-alternative signal-detection procedures. Experiment 1 varied the distribution of point-gain reinforcers for correct responses (Group A) and point-loss punishers for errors (Group B) across conditions. Response bias varied systematically as a function of the relative reinforcer or punisher frequencies. Experiment 2 arranged two conditions - one where an unequal ratio of reinforcement (5ratio1 or 1ratio5) was presented without punishment (R-only), and another where the same reinforcer ratio was presented with an equal distribution of point-loss punishers (R+P). Response bias was significantly greater in the R-only condition than the R+P condition, supporting a subtractive model of punishment. Experiment 3 varied the distribution of point-gain reinforcers for correct responses across four unequal reinforcer ratios (5ratio1, 2ratio1, 1ratio2, 1ratio5) both without (R-only) and with (R+P) an equal distribution of point-loss punishers for errors. Response bias varied systematically with changes in relative reinforcer frequency for both R-only and R+P conditions, with 5 out of 8 participants showing increases in sensitivity estimates from R-only to R+P conditions. Overall, the results indicated that punishers have similar but opposite effects to reinforcers in detection procedures and that combined reinforcer and punisher effects might be better modeled by a subtractive punishment model than an additive punishment model, consistent with research using concurrent-schedule choice procedures.
Keywords: humans; mouse-click; point-loss; punishment; signal detection.
Figures
Similar articles
-
Stimulus disparity and punisher control of human signal-detection performance.J Exp Anal Behav. 2010 Mar;93(2):185-201. doi: 10.1901/jeab.2010.93-185. J Exp Anal Behav. 2010. PMID: 20885810 Free PMC article.
-
Asymmetry of reinforcement and punishment in human choice.J Exp Anal Behav. 2008 Mar;89(2):157-67. doi: 10.1901/jeab.2008.89-157. J Exp Anal Behav. 2008. PMID: 18422016 Free PMC article.
-
Reinforcer control and human signal-detection performance.J Exp Anal Behav. 2000 May;73(3):275-90. doi: 10.1901/jeab.2000.73-275. J Exp Anal Behav. 2000. PMID: 10866352 Free PMC article. Clinical Trial.
-
A model for discriminating reinforcers in time and space.Behav Processes. 2016 Jun;127:62-73. doi: 10.1016/j.beproc.2016.03.010. Epub 2016 Mar 22. Behav Processes. 2016. PMID: 27016156 Review.
-
Token reinforcement: a review and analysis.J Exp Anal Behav. 2009 Mar;91(2):257-86. doi: 10.1901/jeab.2009.91-257. J Exp Anal Behav. 2009. PMID: 19794838 Free PMC article. Review.
Cited by
-
Stimulus disparity and punisher control of human signal-detection performance.J Exp Anal Behav. 2010 Mar;93(2):185-201. doi: 10.1901/jeab.2010.93-185. J Exp Anal Behav. 2010. PMID: 20885810 Free PMC article.
References
-
- Alsop B. Behavioral models of signal detection and detection models of choice. In: Commons M.L, Nevin J.A, Davison M, editors. Signal detection: Mechanisms, models, and applications. Hillsdale, New Jersey: Lawrence Erlbaum Associates, Inc; 1991. pp. 39–55. In.
Publication types
MeSH terms
LinkOut - more resources
Full Text Sources
