. 2009 Jul;92(1):113-29.
doi: 10.1901/jeab.2009.92-113.

Ensemble recordings in awake rats: achieving behavioral regularity during multimodal stimulus processing and discriminative learning

Affiliations

Ensemble recordings in awake rats: achieving behavioral regularity during multimodal stimulus processing and discriminative learning

Eunjeong Lee et al. J Exp Anal Behav. 2009 Jul.

Abstract

To meet an increasing need to examine the neurophysiological underpinnings of behavior in rats, we developed a behavioral system for studying sensory processing, attention and discrimination learning in rats while recording firing patterns of neurons in one or more brain areas of interest. Because neuronal activity is sensitive to variations in behavior which may confound the identification of neural correlates, a specific aim of the study was to allow rats to sample sensory stimuli under conditions of strong behavioral regularity. Our behavioral system allows multimodal stimulus presentation and is coupled to modules for delivering reinforcement, simultaneous monitoring of behavior and recording of ensembles of well isolated single neurons. Using training protocols for simple and compound discrimination, we validated the behavioral system with a group of 4 rats. Within these tasks, a majority of medial prefrontal neurons showed significant firing-rate changes correlated to one or more trial events that could not be explained from significant variation in head position. Thus, ensemble recordings can be combined with discriminative learning tasks under conditions of strong behavioral regularity.

Keywords: attention; electrode; olfactory; prefrontal cortex; single unit; spike; visual discrimination.


Figures

Fig 1
Fig 1
Behavioral system for multimodal stimulus presentation and discrimination learning. The data acquisition system, comprising amplifiers, oscilloscopes (OSC) and a behavioral monitoring and recording system, is shown on the left. The multimodal stimulus system is shown on the right and includes a Faraday cage (a), an odor application system (b), a DC-powered ventilator (c), a behavioral cage (d) with attached multimodal stimulus chamber (MMSC) (e). A videocamera (f) was attached to the ceiling of the Faraday cage and, upon neurophysiological recording, spike and EEG signals were conveyed to the amplifiers via a headstage, cables and a commutator.
Fig 2
Fig 2
Details of the multimodal stimulus chamber (MMSC) and adjacent behavioral cage. A: the behavioral cage included a head-entry port (a) for gaining access to the MMSC; a horizontal shelf upon which the rat put its forepaws during stimulus sampling (b); a light for signalling trial onset (c); an LCD screen for presenting visual stimuli (d); and a fluid well (e). B: MMSC, with head-entry port (a); LCD screen (d); and odor delivery nozzle (f). C: fluid well, with LED detecting “nose down” response (g); optic sensor detecting licking behavior (h); and three nozzles for fluid delivery (one of which is indicated by ‘i’). D: front panel of the MMSC with head-entry port fitted with LED (j) and a mirror (k) for creating a dual beam, facilitating detection of head entry.
Fig 3
Fig 3
General time schedule of a trial for both simple and compound discrimination. A trial was initiated by the onset of a trial light. Upon a head poke by the animal into the MMSC, a single unimodal stimulus was applied (SD) or two stimuli of different modality were simultaneously presented (CD). Upon head withdrawal from the MMSC, the rat generated either a NoGo or Go response. In case of a Go response, the rat walked over to the fluid well (movement period), put its nose down into this well and consumed a volume of sucrose or quinine solution. Trials were separated by an intertrial interval.
Fig 4
Fig 4
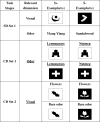
Stimulus presentation schedules of the simple (SD) and compound (CD) discrimination tasks. Chronological order is from top to bottom. Four rats were trained to discriminate visual stimuli first (top row) and then proceeded with simple odor discrimination. This training was followed, first, by compound discrimination with odor as relevant dimension (using four combinations consisting of two novel odors and two novel visual patterns; CD set 1) and subsequently with vision as relevant dimension (CD set 2, using novel examplars in both the visual and olfactory domain). Note that in the CD phase, the S+ and S− were combined with exemplars in the irrelevant dimension. The 4 rats all experienced the same visual and olfactory examplars in the same order.
Fig 5
Fig 5
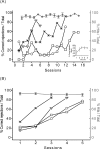
Performance in simple discrimination learning. (A) The percentage of correct rejections (NoGo responses to S−) in the visual discrimination task was plotted in black as a function of session number for 4 individual rats indicated by different symbols. The mean percentage of hits (Go responses to S+) of the same rats is shown in gray. Inset shows average performance in each block of the last session in the main panel. Criterion was at 70% correct rejections in two consecutive blocks. (B) Idem for olfactory discrimination, which followed the visual task in time.
Fig 6
Fig 6
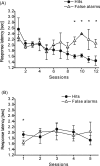
Response latencies in simple discrimination learning. (A) Response latency in simple visual discrimination plotted as function of session number; open triangles symbolize mean latency for false-alarm (erroneous Go) responses, filled circles symbolize hits (correct Go responses). The mean latency was different (p < .05, ANOVA) for these two types of responses in the final four sessions (marked by *). (B) Idem for simple olfactory discrimination; the latency for hits and false-alarm responses differed significantly only in the first session.
Fig 7
Fig 7
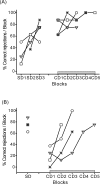
Discriminative performance before and after the transition from simple to compound discrimination learning. The percentage of correct rejections is plotted as a function of trial blocks, each of which contained eight S+ trials and eight S− trials. (A) presents the transition from simple olfactory discrimination to the compound phase, where odor remained the relevant dimension. This session followed the olfactory SD task (Figure 5 and 6B) in time. In (B) rats performed simple visual discrimination and proceeded with the compound phase, keeping vision as relevant dimension. This session followed the transitional SD-to-CD olfactory task (Figure 7A) in time. See Figure 5 for plotting conventions and behavioral criterion.
Fig 8
Fig 8
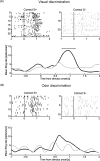
Examples of peri-event time histograms (PETHs) synchronized on stimulus onset, taken from two medial prefrontal single units. (A) Raster plots of PETHs for correct responses on S+ (left) and S− (right) trials in a simple visual discrimination task. A correct response on the visual S+ consisted of a Go response towards the fluid well (outcome: sucrose solution), whereas a correct response on the S− was a NoGo response. The graph below the raster plots shows the smoothed mean firing rate for Correct S+ (black) and Correct S− (grey) trials, departing from a bin size of 50 ms. The two curves were significantly different at p < .05 as indicated by a horizontal bar on top of the curves. (B) Idem as (A), but now for a simple odor disrimination task. Curves for Correct S+ (black) and Correct S− (grey) did not differ significantly.
Fig 9
Fig 9
Mean head position during the stimulus sampling period of the simple discrimination task (both visual and olfactory sessions were included, N  =  3 and N  =  7, respectively). Graphs show mean head position for Correct S+ and Correct S− trials in SD tasks (A, B; solid and dashed lines, respectively) and SD (dash-dotted line) versus CD (dotted line) in Correct S+ trials (C, D) and Correct S− trials (E, F). Mean head position was computed based on frame-to-frame positions of the center of the rat's head as estimated by the Cheetah Neuralynx system for videotracking LEDs on the rat's headstage (sampling rate: 25 frames/s). Grey bands flanking the mean-position curves indicate 95% confidence intervals, which were obtained by a bootstrapping method (Zoubir & Iskander, 2004). Dark grey areas reflect overlap in confidence intervals between Correct S+ and Correct S− trials or between SD and CD trials. X position (A, C and E) and Y position (B, D and F) are plotted as a function of time elapsed from stimulus onset. Although the head was not stationary during stimulus sampling, there was no significant difference between Correct S+ and Correct S− trials in SD, or between SD and CD studied for Correct S+ and Correct S− trials separately.

Similar articles

Cited by

References

    1. Baeg E.H, Kim Y.B, Huh K, Mook-Jung I, Kim H.T, Jung M.W. Dynamics of population code for working memory in the prefrontal cortex. Neuron. 2003;40:177–188. - PubMed
    1. Birrell J.M, Brown V.J. Medial frontal cortex mediates perceptual attentional set shifting in the rat. Journal of Neuroscience. 2000;20:4320–4324. - PMC - PubMed
    1. Brigman J.L, Bussey T.J, Saksida L.M, Rothblat L.A. Discrimination of multidimensional visual stimuli by mice: intra- and extradimensional shifts. Behavioral Neuroscience. 2005;119:839–842. - PubMed
    1. Brushfield A.M, Luu T.T, Callahan B.D, Gilbert P.E. A comparison of discrimination and reversal learning for olfactory and visual stimuli in aged rats. Behavioral Neuroscience. 2008;122:54–62. - PMC - PubMed
    1. Bussey T.J, Muir J.L, Robbins T.W. A novel automated touchscreen procedure for assessing learning in the rat using computer graphic stimuli. Neuroscience Research Communications. 1994;15:103–110.

Publication types

LinkOut - more resources