

Vagal sparing surgical technique but not stoma size affects body weight loss in rodent model of gastric bypass
- PMID: 20119735
- PMCID: PMC3715840
- DOI: 10.1007/s11695-010-0075-5
Vagal sparing surgical technique but not stoma size affects body weight loss in rodent model of gastric bypass
Abstract
Background: The aim of this study was to evaluate whether gastric bypass with or without vagal preservation resulted in a different outcome.
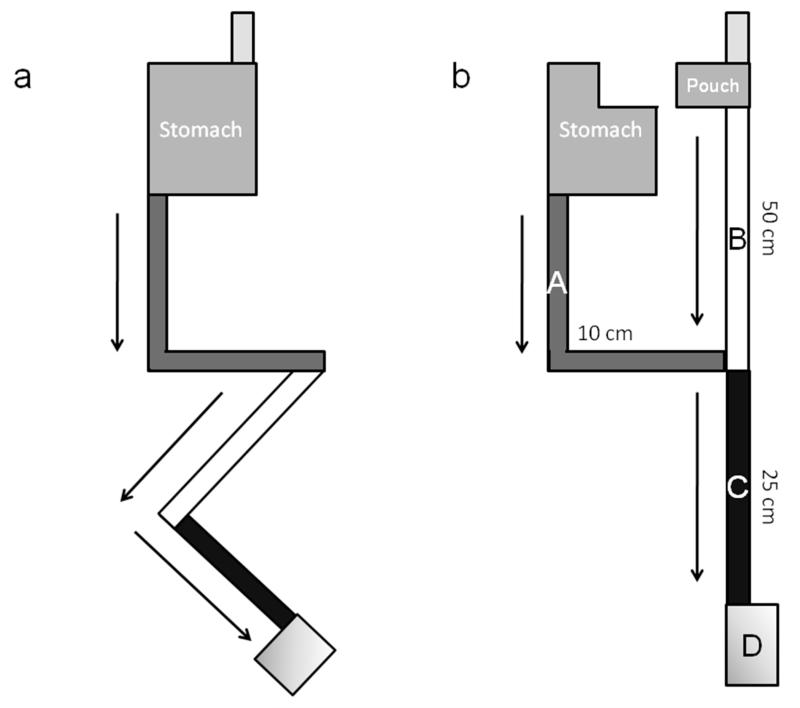
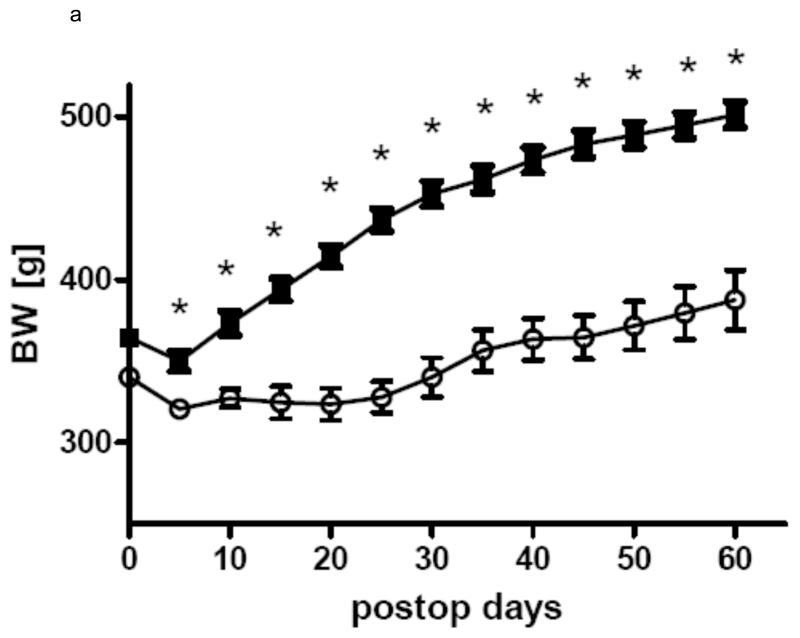
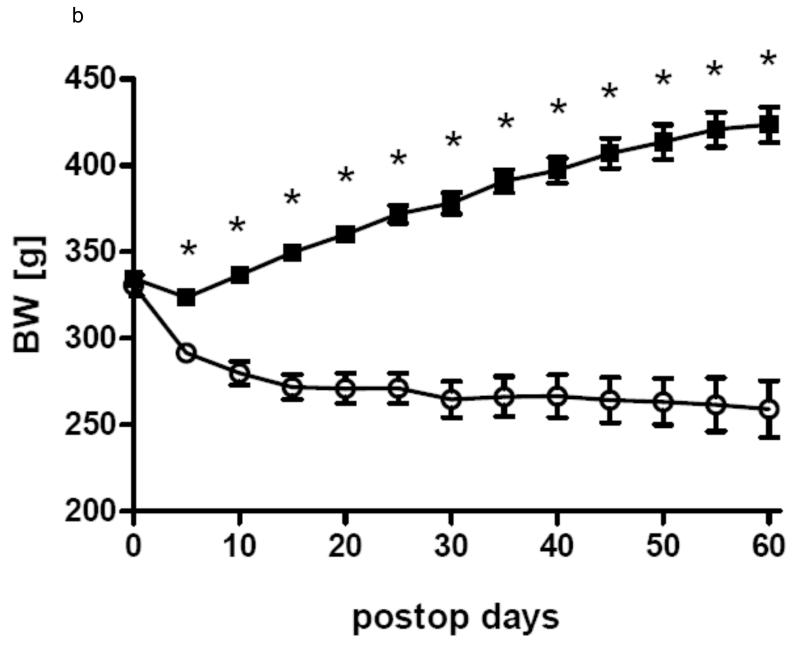
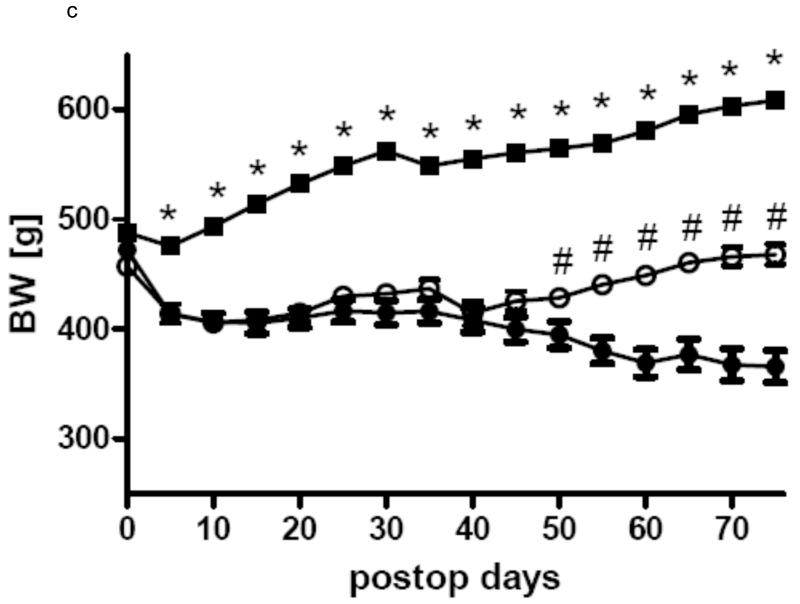
Methods: Body weight, food intake and postprandial peptide YY (PYY) and glucagon-like peptide (GLP-1) levels were compared between gastric bypass (n = 55) and sham-operated rats (n = 27) in three groups. In group 1 (n = 17), the vagal nerve was not preserved, while in group 2 the vagal nerve was preserved during gastric bypass (n = 10). In group 3, gastric bypass rats (n = 28) were randomised for either one of the two techniques.
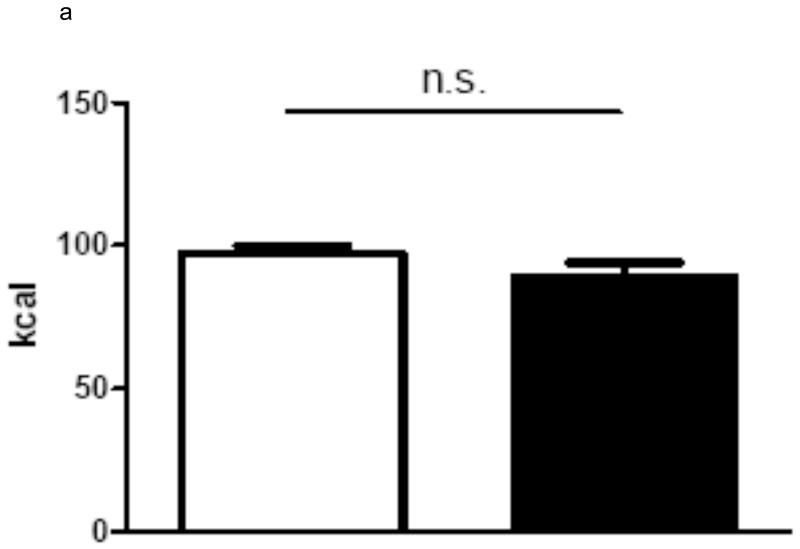
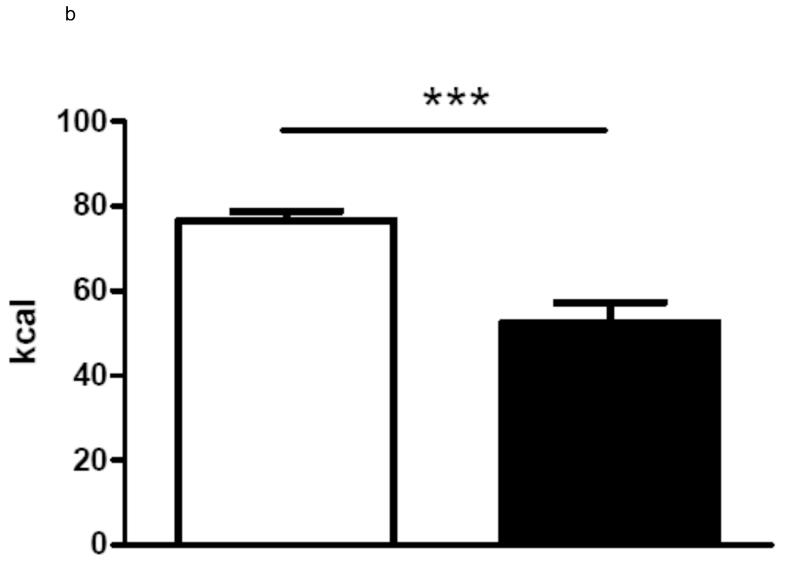
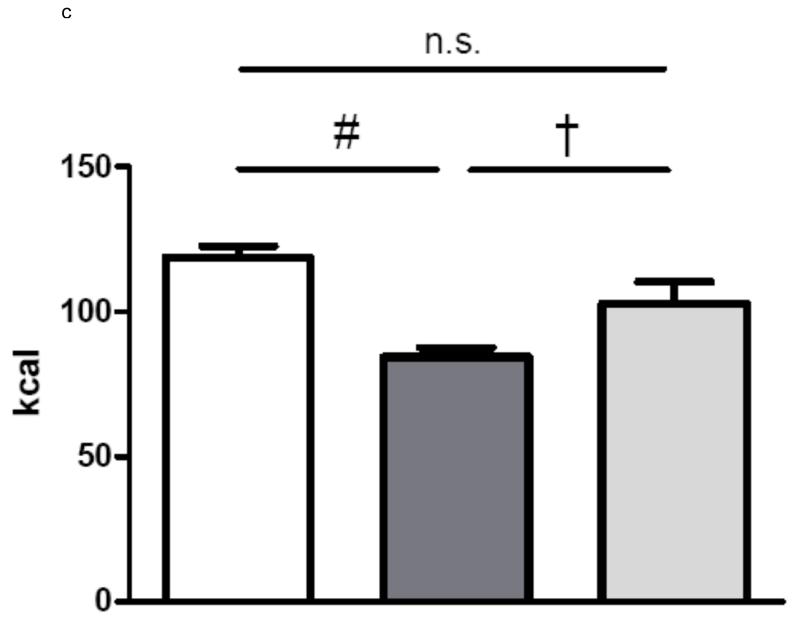
Results: Rats in which the vagal nerve was preserved during gastric bypass showed a lower body weight (p < 0.001) and reduced food intake (p < 0.001) compared to rats in which the vagal nerve was not preserved during the gastric bypass operation. Levels of PYY and GLP-1 were significantly increased after gastric bypass compared to sham-operated controls (p < 0.05), but there was no difference between gastric bypass rats with and without vagal preservation. Differences in food intake and body weight were not related to the size of the gastro-jejunostomy in gastric bypass rats. There were no signs of malabsorption or inflammation after gastric bypass.
Conclusion: We propose that the vagal nerve should be preserved during the gastric bypass operation as this might play an important role for the mechanisms that induce weight loss and reduce food intake in rats. In contrast, the gastro-jejunal stoma size was found to be of minor relevance.
Figures
Similar articles
-
Gastric bypass surgery restores meal stimulation of the anorexigenic gut hormones glucagon-like peptide-1 and peptide YY independently of caloric restriction.Surg Endosc. 2012 Apr;26(4):1086-94. doi: 10.1007/s00464-011-2004-7. Epub 2011 Nov 2. Surg Endosc. 2012. PMID: 22044971 Free PMC article.
-
Preoperative assessment of gut hormones does not correlate to weight loss after Roux-en-Y gastric bypass surgery.Surg Obes Relat Dis. 2014 Sep-Oct;10(5):822-8. doi: 10.1016/j.soard.2014.04.018. Epub 2014 Apr 29. Surg Obes Relat Dis. 2014. PMID: 25282191
-
Peptide YY and glucagon-like peptide-1 contribute to decreased food intake after Roux-en-Y gastric bypass surgery.Int J Obes (Lond). 2016 Nov;40(11):1699-1706. doi: 10.1038/ijo.2016.121. Epub 2016 Aug 30. Int J Obes (Lond). 2016. PMID: 27434221 Clinical Trial.
-
Peptide YY(1-36) and peptide YY(3-36): Part II. Changes after gastrointestinal surgery and bariatric surgery.Obes Surg. 2006 Jun;16(6):795-803. doi: 10.1381/096089206777346619. Obes Surg. 2006. PMID: 16756746 Review.
-
A Meta-Analysis of GLP-1 After Roux-En-Y Gastric Bypass: Impact of Surgical Technique and Measurement Strategy.Obes Surg. 2018 Mar;28(3):615-626. doi: 10.1007/s11695-017-2913-1. Obes Surg. 2018. PMID: 28871519 Review.
Cited by
-
Does the hepatic branch of vagus mediate the secretion of glucagon-like peptide-1 during the Roux-en-Y gastric bypass surgery?J Gastrointest Surg. 2014 Nov;18(11):1957-64. doi: 10.1007/s11605-014-2632-z. Epub 2014 Sep 3. J Gastrointest Surg. 2014. Retraction in: J Gastrointest Surg. 2016 Jan;20(1):230. doi: 10.1007/s11605-015-3020-z. PMID: 25183408 Retracted.
-
The evolving obesity challenge: targeting the vagus nerve and the inflammatory reflex in the response.Pharmacol Ther. 2021 Jun;222:107794. doi: 10.1016/j.pharmthera.2020.107794. Epub 2020 Dec 10. Pharmacol Ther. 2021. PMID: 33310156 Free PMC article. Review.
-
Obesity surgery and gut-brain communication.Physiol Behav. 2011 Nov 30;105(1):106-19. doi: 10.1016/j.physbeh.2011.01.023. Epub 2011 Feb 24. Physiol Behav. 2011. PMID: 21315095 Free PMC article. Review.
-
Roux-en-Y gastric bypass in rats increases sucrose taste-related motivated behavior independent of pharmacological GLP-1-receptor modulation.Am J Physiol Regul Integr Comp Physiol. 2012 Mar 15;302(6):R751-67. doi: 10.1152/ajpregu.00214.2011. Epub 2011 Dec 14. Am J Physiol Regul Integr Comp Physiol. 2012. PMID: 22170618 Free PMC article.
-
The gut microbiota to the brain axis in the metabolic control.Rev Endocr Metab Disord. 2019 Dec;20(4):427-438. doi: 10.1007/s11154-019-09511-1. Rev Endocr Metab Disord. 2019. PMID: 31656993 Free PMC article. Review.
References
-
- Allison DB, Saunders SE. Obesity in North America. An overview. Med Clin North Am. 2000;84:305–32. v. - PubMed
-
- Hedley AA, Ogden CL, Johnson CL, et al. Prevalence of overweight and obesity among US children, adolescents, and adults, 1999-2002. JAMA. 2004;291:2847–50. - PubMed
-
- Visscher TL, Seidell JC. The public health impact of obesity. Annu Rev Public Health. 2001;22:355–75. - PubMed
-
- Adams TD, Gress RE, Smith SC, et al. Long-term mortality after gastric bypass surgery. N Engl J Med. 2007;357:753–61. - PubMed
-
- Sjostrom L, Narbro K, Sjostrom CD, et al. Effects of bariatric surgery on mortality in Swedish obese subjects. N Engl J Med. 2007;357:741–52. - PubMed
