. 2010 Mar 1;82(5):1867-80.
doi: 10.1021/ac902571u.

Chemical effects in the separation process of a differential mobility/mass spectrometer system

Affiliations

Chemical effects in the separation process of a differential mobility/mass spectrometer system

Bradley B Schneider et al. Anal Chem. .

Abstract

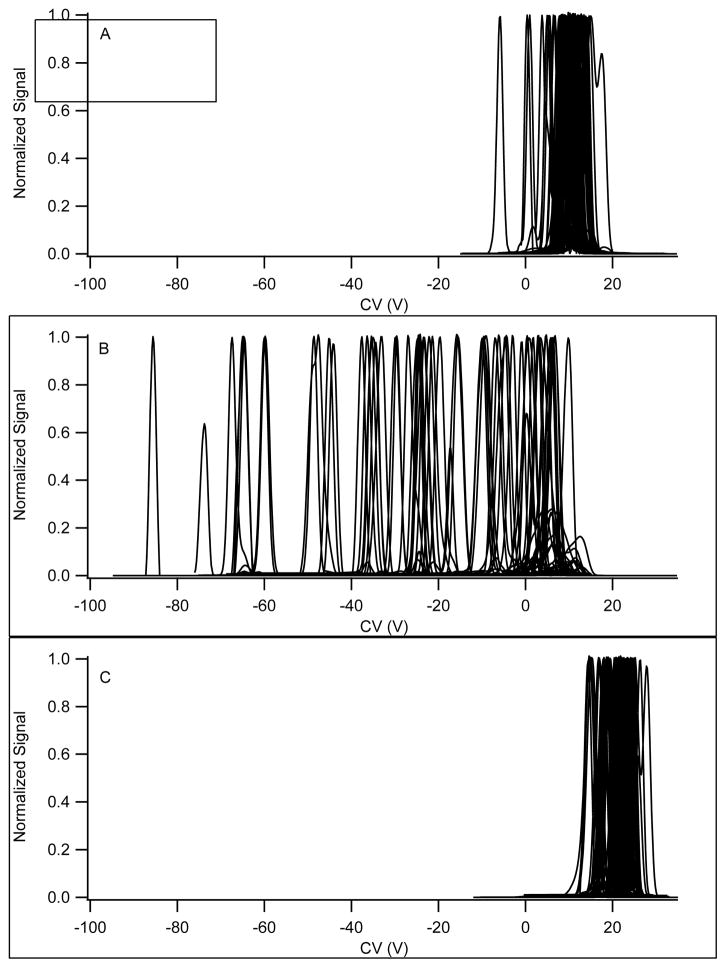
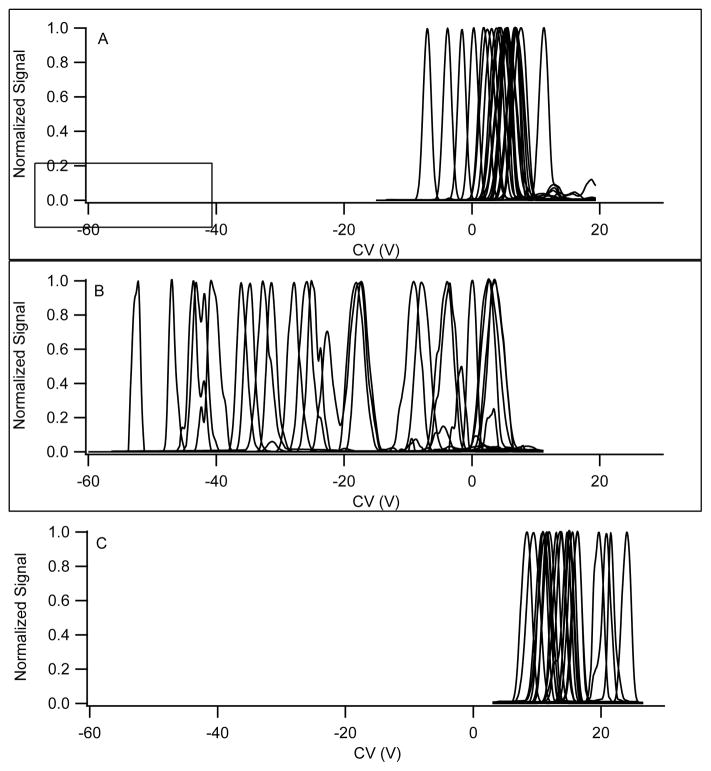
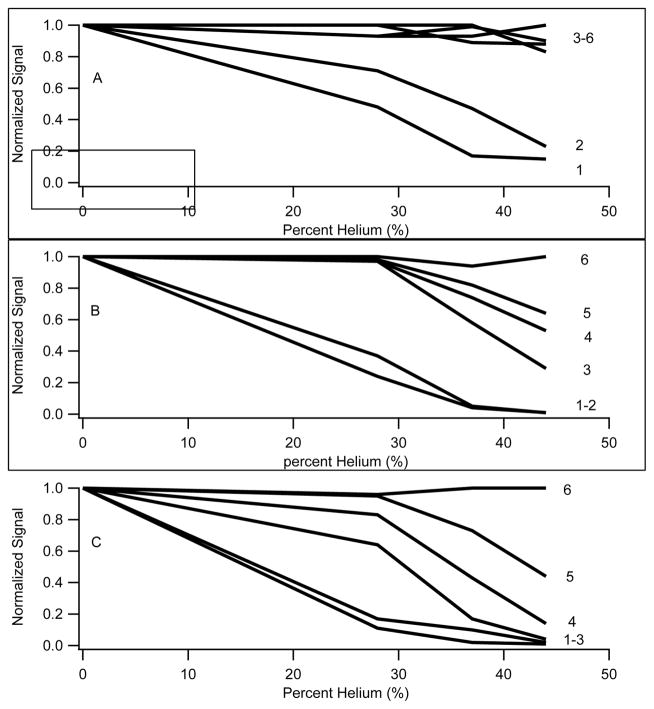
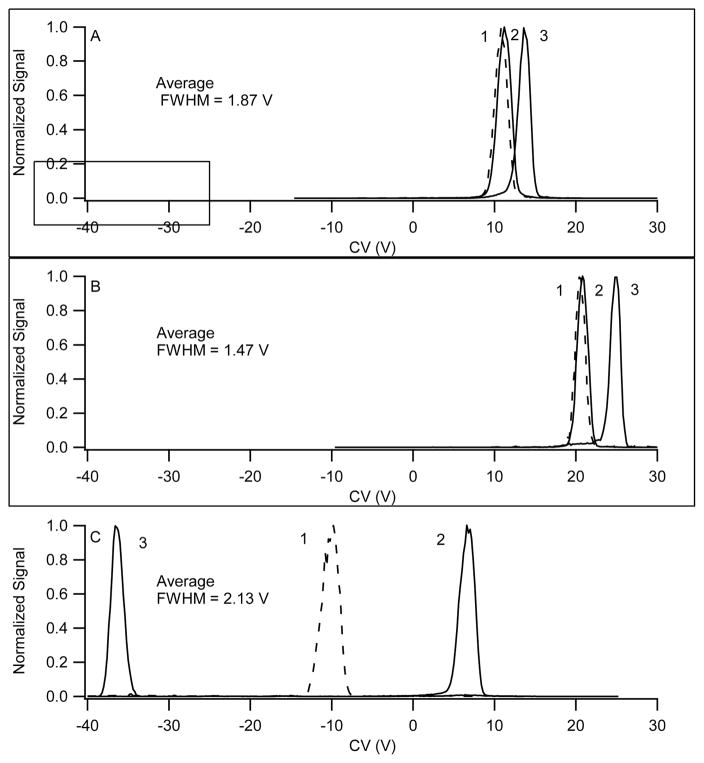
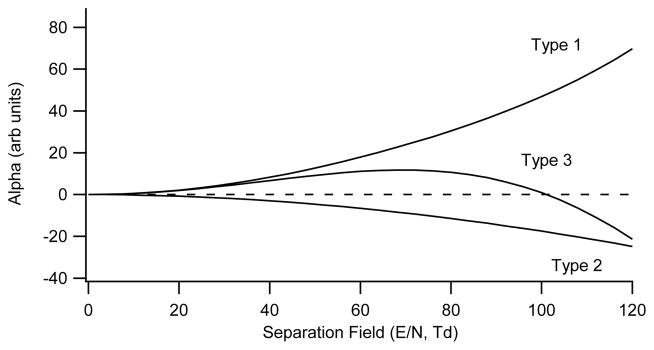
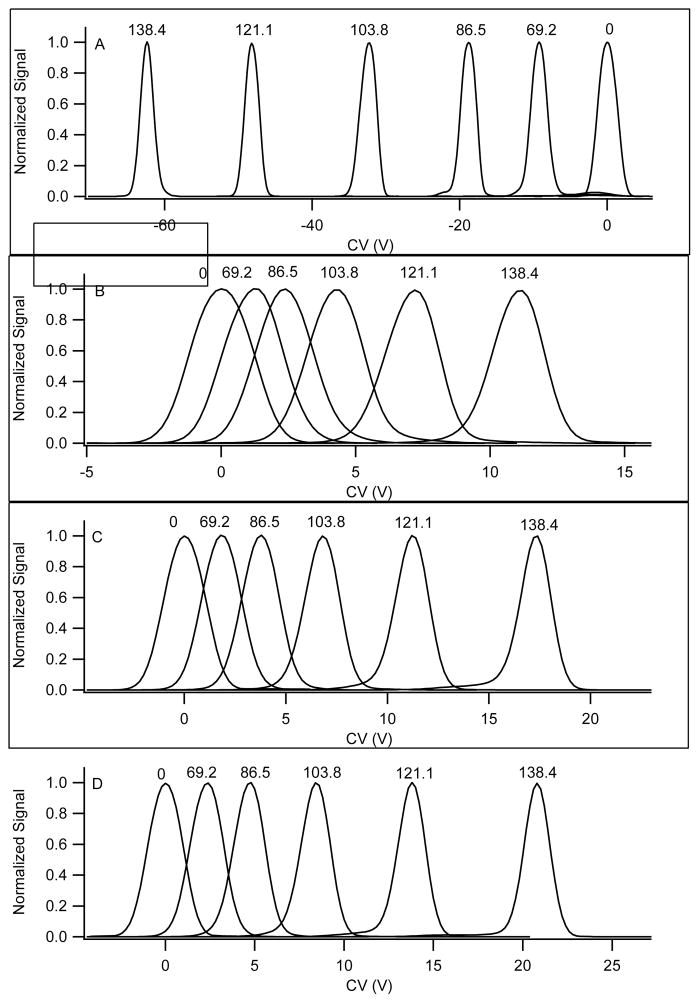
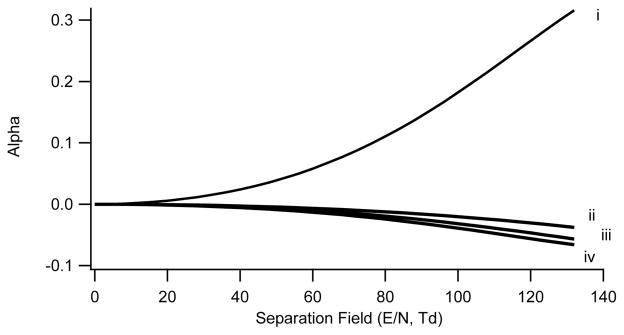
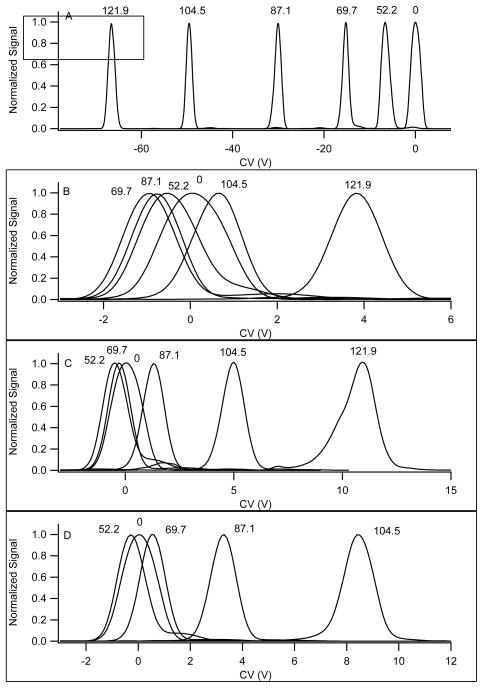
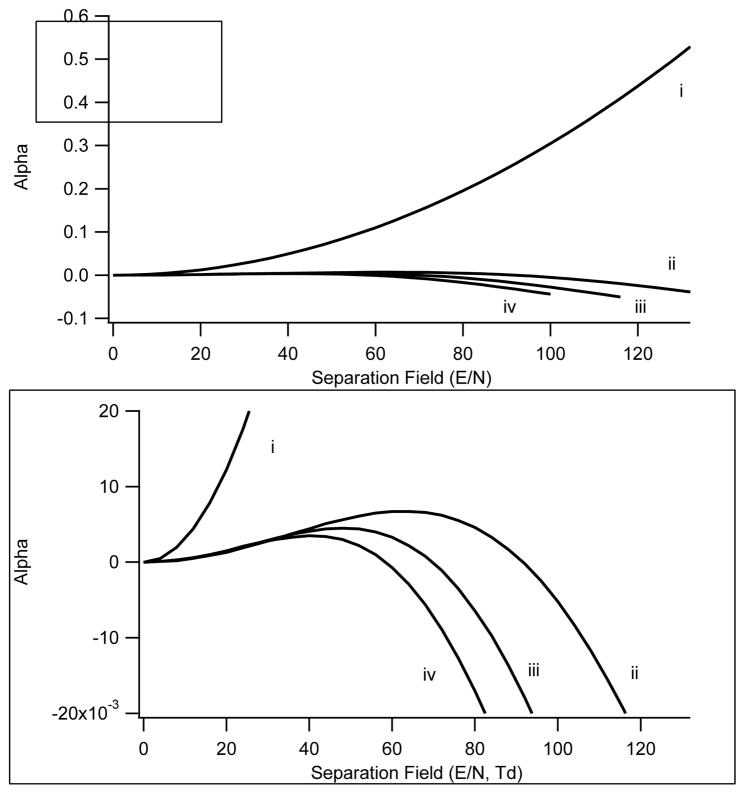
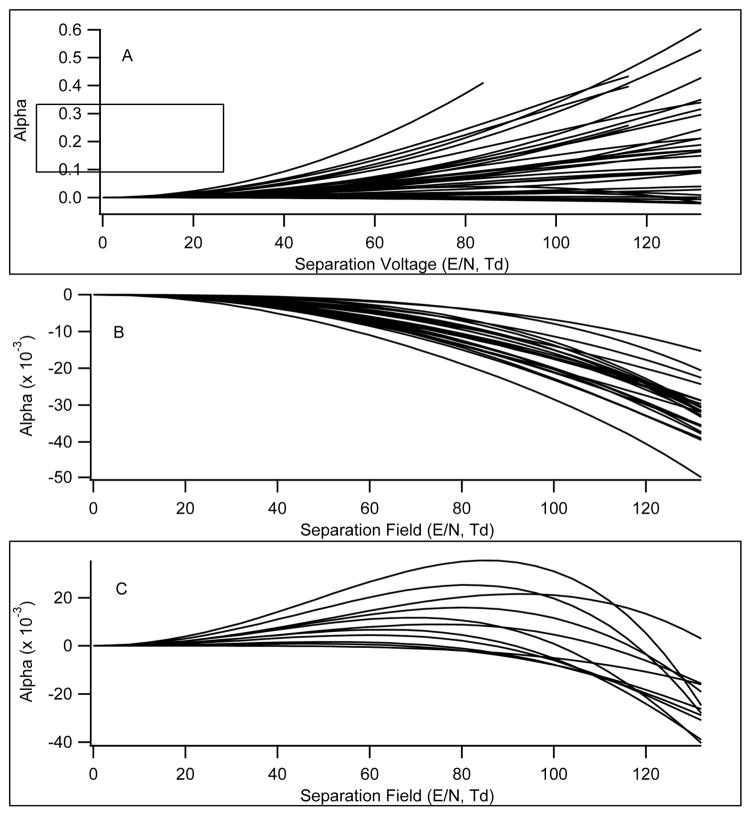
In differential mobility spectrometry (also referred to as high-field asymmetric waveform ion mobility spectrometry), ions are separated on the basis of the difference in their mobility under high and low electric fields. The addition of polar modifiers to the gas transporting the ions through a differential mobility spectrometer enhances the formation of clusters in a field-dependent way and thus amplifies the high- and low-field mobility difference, resulting in increased peak capacity and separation power. Observations of the increase in mobility field dependence are consistent with a cluster formation model, also referred to as the dynamic cluster-decluster model. The uniqueness of chemical interactions that occur between an ion and cluster-forming neutrals increases the selectivity of the separation, and the depression of low-field mobility relative to high-field mobility increases the compensation voltage and peak capacity. The effect of a polar modifier on the peak capacity across a broad range of chemicals has been investigated. We discuss the theoretical underpinnings which explain the observed effects. In contrast to the result with a polar modifier, we find that using mixtures of inert gases as the transport gas improves the resolution by reducing the peak width but has very little effect on the peak capacity or selectivity. The inert gas helium does not cluster and thus does not reduce low-field mobility relative to high-field mobility. The observed changes in the differential mobility alpha parameter exhibited by different classes of compounds when the transport gas contains a polar modifier or has a significant fraction of inert gas can be explained on the basis of the physical mechanisms involved in the separation processes.


Figures

Figure 1
Figure 1
Separation of a 70 compound mixture with various transport gas conditions. A. Nitrogen transport gas. B. Nitrogen with 1.5% 2-propanol. C. Nitrogen gas with 44% helium. The mixture contained 70 compounds generating singly charged positive ions. MRM transitions are monitored for each compound with a dwell time of 10 ms, total cycle time of 2.1 s. The separation field was 132 Td, and under these conditions the number of compounds observed was 69, 58, and 57 out of a total of 70 compounds for the data presented in 1A, 1B, and 1C, respectively. The presence of 44% helium in the transport gas eliminated all compounds with m/z below 195 for the data presented in 1C. The approximate peak capacities are 13, 45, and 11, respectively.
Figure 2
Figure 2
Separation for a 25 compound mixture in negative ion mode. A. Nitrogen transport gas. B. Nitrogen with 1.5% propanol. C. Nitrogen with 44% helium. The separation field was 115.5 Td. MRM transitions were monitored for each compound with a dwell time of 10 ms and a pause between mass ranges of 20 ms for a total cycle time of 750 ms. The number of compounds observed was 24, 24, and 20, for the data presented in 2A, 2B, and 2C, respectively.
Figure 3
Figure 3
Relative intensity plots for 6 ions from the 70 compound mixture with increasing helium content in the transport gas. The separation field was 99.0 Td, 115.5 Td, and 132 Td, for the data present in panes A, B, and C, respectively. The ions were 1) Histamine (m/z 111.6), 2) Leucine (m/z 132), 3) Caffeine (m/z 195), 4) Mephenytoin (m/z 219), 5) Cocaine (m/z 304), and 6) Leucine enkephalin (m/z 556). Increased losses are observed for the majority of ions with increasing helium content in the transport gas. The losses are most dramatic for low m/z ions at high separation voltages. There was a low m/z cut-off when running at the higher 2 separation voltage settings.
Figure 4
Figure 4
Comparison of the separation of 3 selected ions from the 70 compound mixture, demonstrating the differences in peak position and peak FWHM observed when operating with (A) nitrogen transport gas, FWMH ~ 1.87 V, (B) nitrogen with 44% helium transport gas, FWMH ~ 1.47 V, and (C) nitrogen with 1.5% 2-Propanol, FWMH ~ 2.13 V. The ions are 1) dianabol, 2) benoxinate, and 3) clenbuterol, and the separation fields was 132 Td. FWHM is smallest in the He mixture because of the higher mobility in He, and greater in 1.5% 2-propanol because of the reduced mobility of clusters.
Figure 5
Figure 5
Three types of alpha behaviour. The general trends are alpha monotonically increasing (Type A), alpha monotonically decreasing (Type C), and intermediate behaviour with alpha increasing at low separation fields and decreasing at high separation fields (Type B).
Figure 6
Figure 6
Comparative data for norfentanyl under 4 different transport gas conditions. The transport gas composition was A) nitrogen with 1.5% 2-propanol, B) nitrogen, C) nitrogen with 28% helium, and D) nitrogen with 37% helium. The data are normalized to illustrate peak position more clearly. The measured signal was approximately equivalent under each of these conditions, with a full spread ranging from 600,000 to 1,400,000 cps across all transport gas compositions and separation voltage settings. The separation field corresponding to each peak is displayed (Td units) in each pane.
Figure 7
Figure 7
Alpha curve plot for norfentanyl. Alpha Plot for norfentanyl under 4 different transport gas conditions. i) nitrogen with 1.5% 2-propanol, ii) nitrogen, iii) nitrogen with 28% helium, and iv) nitrogen with 37% helium.
Figure 8
Figure 8
Methylhistamine data under 4 different transport gas conditions. The conditions are A) nitrogen with 1.5% 2-propanol, B) nitrogen, C) nitrogen with 28% helium, and D) nitrogen with 37% helium. Note that different scales are used for each figure. The separation field (Td units) corresponding to each peak is displayed in each pane. The data are normalized to more clearly illustrate peak positions. With increasing helium fraction in the transport gas there was a significant reduction in signal at the highest separation voltages, with complete elimination of the peak demonstrated in pane D when the SV was 3500 V.
Figure 9
Figure 9
Alpha curve plots for methyl histamine under 4 different transport gas conditions. i) Nitrogen with 1.5% 2-propanol, ii) nitrogen, iii) nitrogen with 28% helium, and iv) nitrogen with 37% helium. The bottom pane shows an expansion along the Y axis to more clearly demonstrate the Type B behavior in the absence of modifiers.
Figure 10
Figure 10
Plots of alpha versus separation field for a subset of 36 compounds under different transport gas conditions. A) Data for all 36 compounds with nitrogen transport gas modified with 1.5% 2-propanol. B) Data for 25 compounds demonstrating Type C behavior with nitrogen transport gas. C) Data for 11 compounds demonstrating Type B behavior with nitrogen transport gas.

References

    1. Krylov EV, Nazarov EG. Int J Mass Spectrom. 2009;285(3):149–156.
    1. Schneider BB, Covey TR, Coy SL, Krylov EV, Nazarov EG. Int J Mass Spectrom. 2009 accepted for publication. - PMC - PubMed
    1. Krylov EV, Coy SL, Vandermey J, Schneider BB, Covey TR, Nazarov EG. Rev Sci Instr. 2009 in preparation. - PMC - PubMed
    1. Schneider BB, Covey TR, Coy SL, Krylov EV, Nazarov EG. Eur J Mass Spectrom. 2009 accepted for publication. - PMC - PubMed
    1. Revercomb HE, Mason EA. Anal Chem. 1975;47:970–983.

Publication types

MeSH terms