

Regional heterogeneity and diversity in cytokine and chemokine production by astroglia: differential responses to HIV-1 Tat, gp120, and morphine revealed by multiplex analysis
- PMID: 20121167
- PMCID: PMC2856623
- DOI: 10.1021/pr900926n
Regional heterogeneity and diversity in cytokine and chemokine production by astroglia: differential responses to HIV-1 Tat, gp120, and morphine revealed by multiplex analysis
Abstract
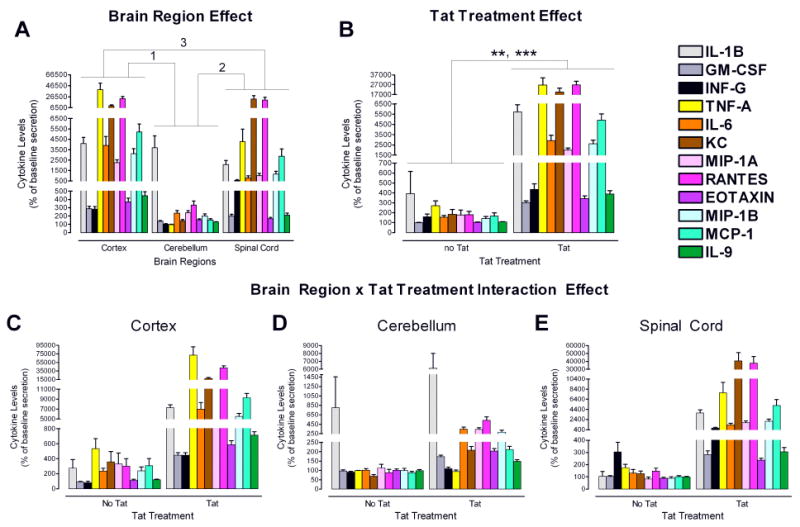
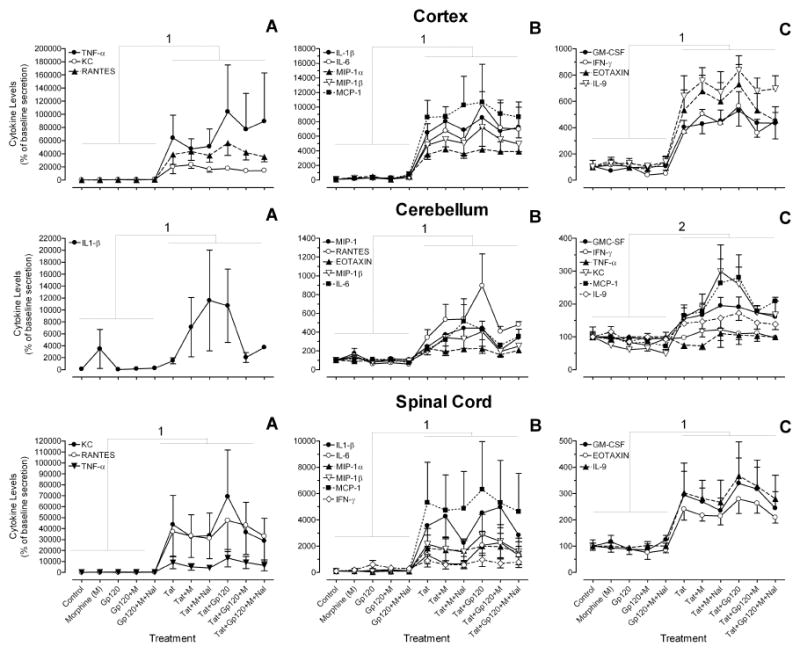
HIV-infected individuals who abuse opiates show a faster progression to AIDS and higher incidence of encephalitis. The HIV-1 proteins Tat and gp120 have been shown to cause neurodegenerative changes either in vitro or when injected or expressed in the CNS, and we have shown that opiate drugs can exacerbate neurotoxic effects in the striatum through direct actions on pharmacologically discrete subpopulations of mu-opioid receptor-expressing astroglia. Opiate coexposure also significantly enhances release of specific inflammatory mediators by astroglia from the striatum, and we theorize that astroglial reactivity may underlie aspects of HIV neuropathology. To determine whether astroglia from different regions of the central nervous system have distinct, intrinsic responses to HIV-1 proteins and opiates, we used multiplex suspension array analyses to define and compare the inflammatory signature of cytokines released by murine astrocytes grown from cerebral cortex, cerebellum, and spinal cord. Results demonstrate significant regional differences in baseline secretion patterns, and in responses to viral proteins. Of importance for the disease process, astrocytes from all regions have very limited inflammatory response to gp120 protein, as compared to Tat protein, either in the presence or absence of morphine. Overall, the chemokine/cytokine release is higher from spinal cord and cortical astroglia than from cerebellar astroglia, paralleling the relatively low incidence of HIV-related neuropathology in the cerebellum.
Conflict of interest statement
Figures

Similar articles
-
Toll-like receptor expression and activation in astroglia: differential regulation by HIV-1 Tat, gp120, and morphine.Immunol Invest. 2011;40(5):498-522. doi: 10.3109/08820139.2011.561904. Epub 2011 Mar 22. Immunol Invest. 2011. PMID: 21425908 Free PMC article.
-
Synergistic increases in intracellular Ca2+, and the release of MCP-1, RANTES, and IL-6 by astrocytes treated with opiates and HIV-1 Tat.Glia. 2005 Apr 15;50(2):91-106. doi: 10.1002/glia.20148. Glia. 2005. PMID: 15630704 Free PMC article.
-
Morphine exacerbates HIV-1 Tat-induced cytokine production in astrocytes through convergent effects on [Ca(2+)](i), NF-kappaB trafficking and transcription.PLoS One. 2008;3(12):e4093. doi: 10.1371/journal.pone.0004093. Epub 2008 Dec 31. PLoS One. 2008. PMID: 19116667 Free PMC article.
-
Opiate drug use and the pathophysiology of neuroAIDS.Curr HIV Res. 2012 Jul;10(5):435-52. doi: 10.2174/157016212802138779. Curr HIV Res. 2012. PMID: 22591368 Free PMC article. Review.
-
Impact of opiate-HIV-1 interactions on neurotoxic signaling.J Neuroimmune Pharmacol. 2006 Mar;1(1):98-105. doi: 10.1007/s11481-005-9000-4. J Neuroimmune Pharmacol. 2006. PMID: 18040795 Review.
Cited by
-
Differential innate immune response programs in neuronal subtypes determine susceptibility to infection in the brain by positive-stranded RNA viruses.Nat Med. 2013 Apr;19(4):458-64. doi: 10.1038/nm.3108. Epub 2013 Mar 3. Nat Med. 2013. PMID: 23455712 Free PMC article.
-
HIV-1 envelope protein gp120 up regulates CCL5 production in astrocytes which can be circumvented by inhibitors of NF-κB pathway.Biochem Biophys Res Commun. 2011 Oct 14;414(1):112-7. doi: 10.1016/j.bbrc.2011.09.033. Epub 2011 Sep 14. Biochem Biophys Res Commun. 2011. PMID: 21945445 Free PMC article.
-
Opiate Drugs with Abuse Liability Hijack the Endogenous Opioid System to Disrupt Neuronal and Glial Maturation in the Central Nervous System.Front Pediatr. 2018 Jan 23;5:294. doi: 10.3389/fped.2017.00294. eCollection 2017. Front Pediatr. 2018. PMID: 29410949 Free PMC article. Review.
-
Morphine enhances HIV-1SF162-mediated neuron death and delays recovery of injured neurites.PLoS One. 2014 Jun 20;9(6):e100196. doi: 10.1371/journal.pone.0100196. eCollection 2014. PLoS One. 2014. PMID: 24949623 Free PMC article.
-
HIV-1 Tat Dysregulates the Hypothalamic-Pituitary-Adrenal Stress Axis and Potentiates Oxycodone-Mediated Psychomotor and Anxiety-Like Behavior of Male Mice.Int J Mol Sci. 2020 Nov 3;21(21):8212. doi: 10.3390/ijms21218212. Int J Mol Sci. 2020. PMID: 33153023 Free PMC article.
References
-
- Ye H, Hernandez MR. Heterogeneity of astrocytes in human optic nerve head. J Comp Neurol. 1995;362(4):441–52. - PubMed
-
- Israel JM, Schipke CG, Ohlemeyer C, Theodosis DT, Kettenmann H. GABAA receptor-expressing astrocytes in the supraoptic nucleus lack glutamate uptake and receptor currents. Glia. 2003;44(2):102–10. - PubMed
-
- Won CL, Oh YS. cAMP-induced stellation in primary astrocyte cultures with regional heterogeneity. Brain Res. 2000;887(2):250–8. - PubMed
-
- Lee Y, Su M, Messing A, Brenner M. Astrocyte heterogeneity revealed by expression of a GFAP-LacZ transgene. Glia. 2006;53(7):677–87. - PubMed
-
- Shinoda H, Marini AM, Cosi C, Schwartz JP. Brain region and gene specificity of neuropeptide gene expression in cultured astrocytes. Science. 1989;245:415–417. - PubMed
Publication types
MeSH terms
Substances
Grants and funding
LinkOut - more resources
Full Text Sources
Research Materials
