. 2010 Feb 25;114(7):2383-9.
doi: 10.1021/jp911452z.

Hydrogen bond migration between molecular sites observed with ultrafast 2D IR chemical exchange spectroscopy

Affiliations

Hydrogen bond migration between molecular sites observed with ultrafast 2D IR chemical exchange spectroscopy

Daniel E Rosenfeld et al. J Phys Chem B. .

Abstract

Hydrogen-bonded complexes between phenol and phenylacetylene are studied using ultrafast two-dimensional infrared (2D IR) chemical exchange spectroscopy. Phenylacetylene has two possible pi hydrogen bonding acceptor sites (phenyl or acetylene) that compete for hydrogen bond donors in solution at room temperature. The OD stretch frequency of deuterated phenol is sensitive to which acceptor site it is bound. The appearance of off-diagonal peaks between the two vibrational frequencies in the 2D IR spectrum reports on the exchange process between the two competitive hydrogen-bonding sites of phenol-phenylacetylene complexes in the neat phenylacetylene solvent. The chemical exchange process occurs in approximately 5 ps and is assigned to direct hydrogen bond migration along the phenylacetylene molecule. Other nonmigration mechanisms are ruled out by performing 2D IR experiments on phenol dissolved in the phenylacetylene/carbon tetrachloride mixed solvent. The observation of direct hydrogen bond migration can have implications for macromolecular systems.


Figures

Figure 1
Figure 1
A molecular electrostatic potential energy map of the phenylacetylene molecule is shown (calculated with DFT at the B3LYP/6-311G(d,p) level of theory). Blue corresponds to electrostatic potentials ≥ 20 kcal/mol, red corresponds to electrostatic potentials ≤ −14 kcal/mol. The limits have been adjusted for high contrast. Superimposed is a schematic of phenol hydrogen bond migration along the phenylacetylene. The black curve is a qualitative rendering of the expected electrostatic interaction.
Figure 2
Figure 2
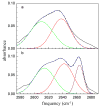
Linear absorbance spectra for phenol in pure phenylacetylene (a) and phenol dissolved in a phenylacetylene and carbon tetrachloride mixture (b) (black curves). Also shown are fits to two and three Gaussians in a and b, respectively (blue dashed curves). The Gaussians that comprise the fits are also shown. The unfit portions of the spectral wings are most likely due to changes in the strong phenylacetylene background upon complexation that cannot be subtracted and also the light tails of the Gaussian lineshape function. Also, other sub-ensembles of complexes may be present in small amounts. Our models were only fit over the strongly peaked portions of the spectra.
Figure 3
Figure 3
The 0→1 transition region of the 2D IR Chemical Exchange Spectra for deuterated phenol dissolved in phenylacetylene (top panel) and in the mixed solvent, phenylacetylene/carbon tetrachloride (bottom panel). Chemical exchange causes off-diagonal peaks to grow in as Tw increases.
Figure 4
Figure 4
Relative peak amplitudes (squares, circles triangles) for the phenol dissolved in phenylacetylene. All of the points are normalized by the R state amplitude. The black line is the fit T state amplitude. The red circles are the TR exchange off-diagonal peak amplitudes, and the green triangles are the RT exchange off-diagonal peak amplitudes. The red line is the fit for the off-diagonal peak amplitudes. The fits yield the TR exchange time constant of 4.2 ps (see text).
Figure 5
Figure 5
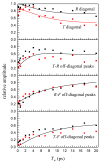
From top to bottom these panels are the amplitudes of the R and T diagonal peaks, the T-R, the R-F, and the R-T off-diagonal peaks all normalized to the diagonal F peak. The curves are the simultaneous fits to all of the data. In the off-diagonal peak plots, the black squares are the TR, RF, and TF data, and the red circles are the reverse process data. See text for discussion of trends.

References

    1. Steiner T, Koellner G. J Mol Biol. 2001;305:535. - PubMed
    1. Meyer EA, Castellano RK, Diederich F. Angew Chem Int Edit. 2003;42:1210. - PubMed
    1. Hagan MF, Chandler D. Biophys J. 2006;91:42. - PMC - PubMed
    1. Huggins CM, Pimentel GC. J Phys Chem Us. 1956;60:1615.
    1. Zheng JR, Fayer MD. J Am Chem Soc. 2007;129:4328. - PMC - PubMed

Publication types