. 2010 Feb;139(1):70-94.
doi: 10.1037/a0018128.

Perceptual discrimination in static and dynamic noise: the temporal relation between perceptual encoding and decision making

Affiliations

Perceptual discrimination in static and dynamic noise: the temporal relation between perceptual encoding and decision making

Roger Ratcliff et al. J Exp Psychol Gen. 2010 Feb.

Abstract

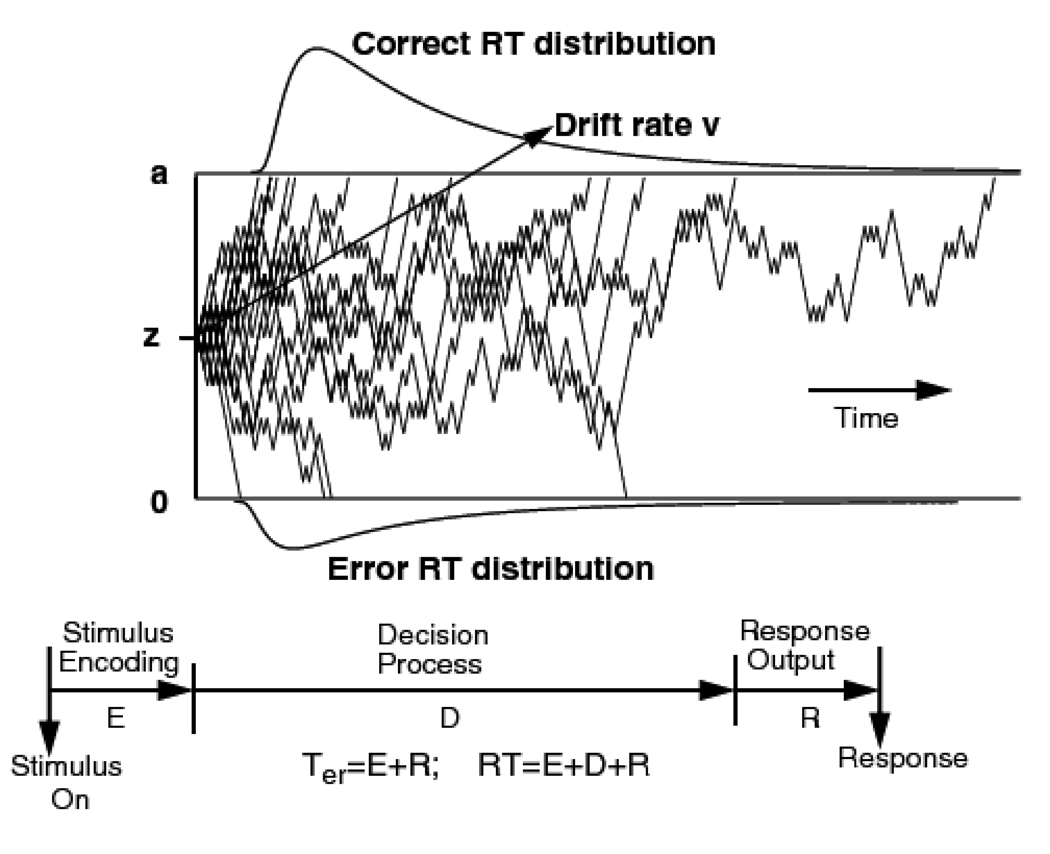
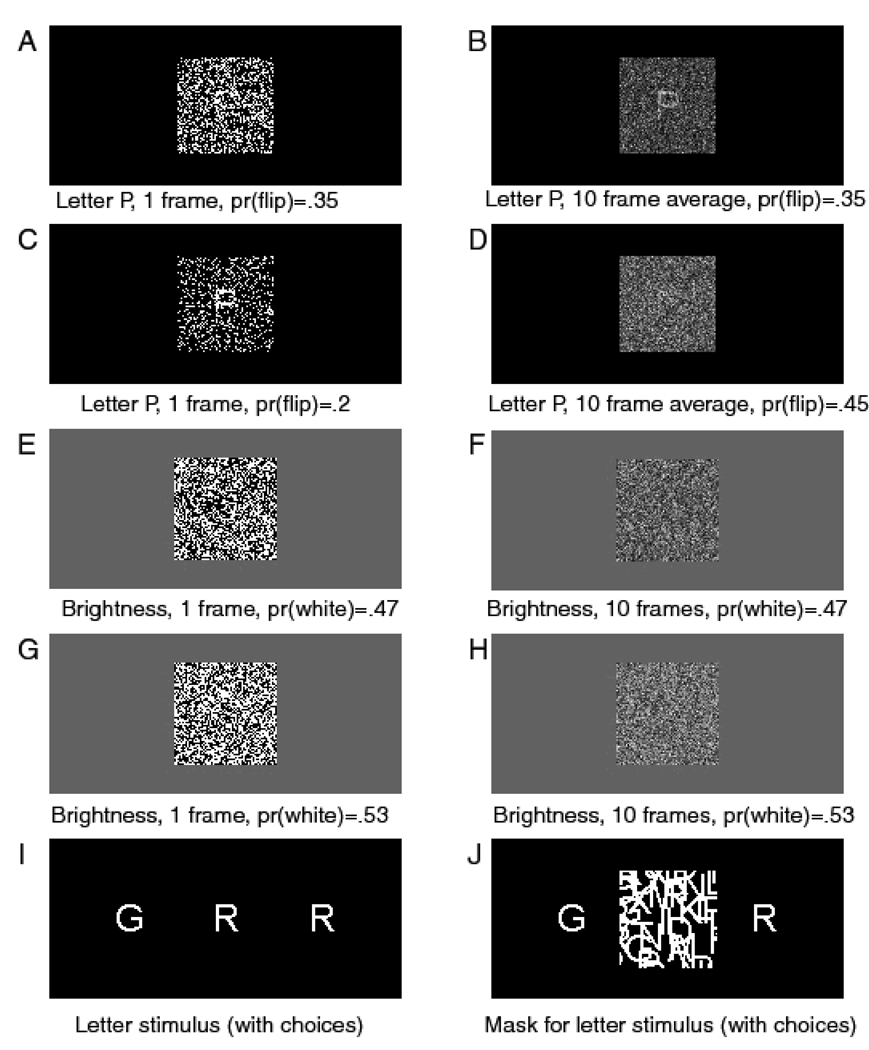
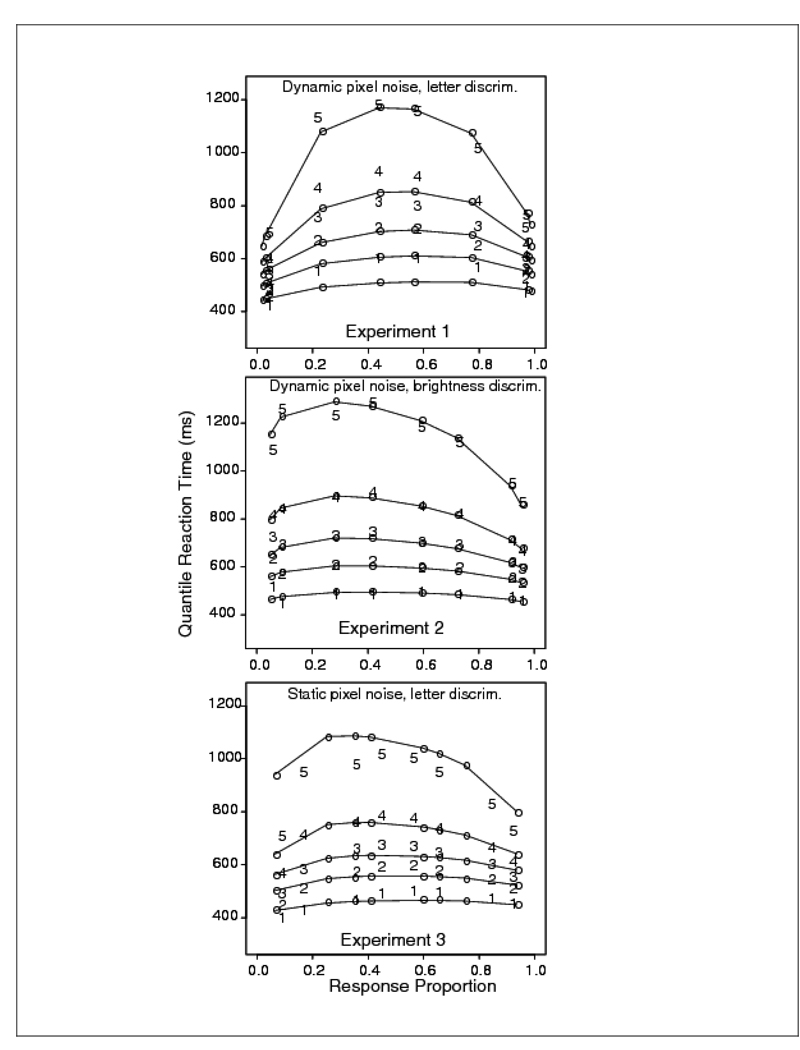
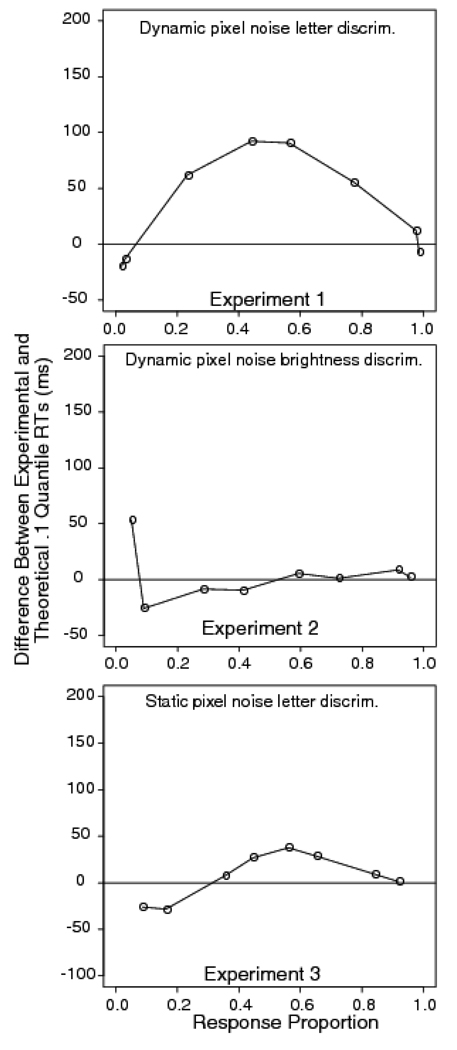
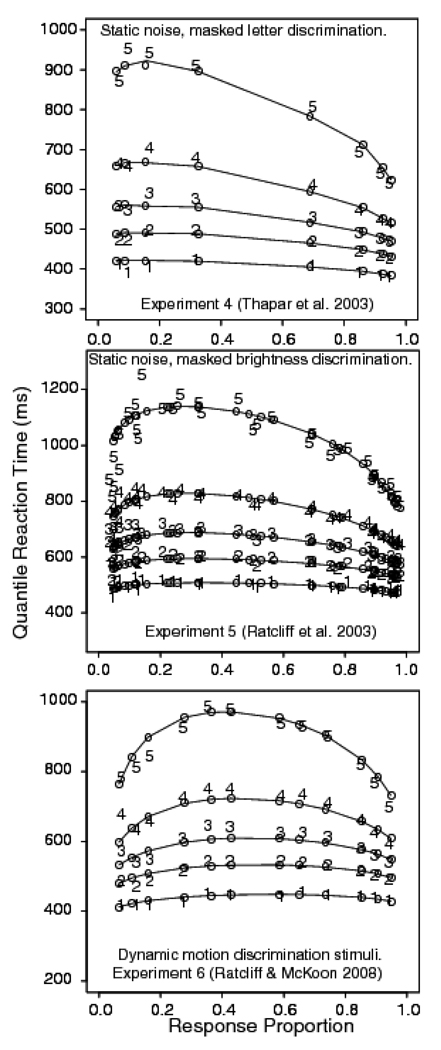
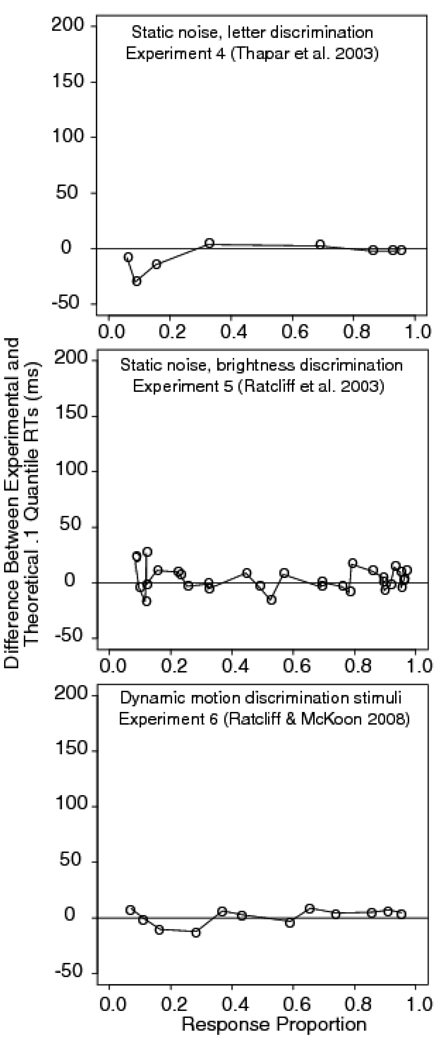
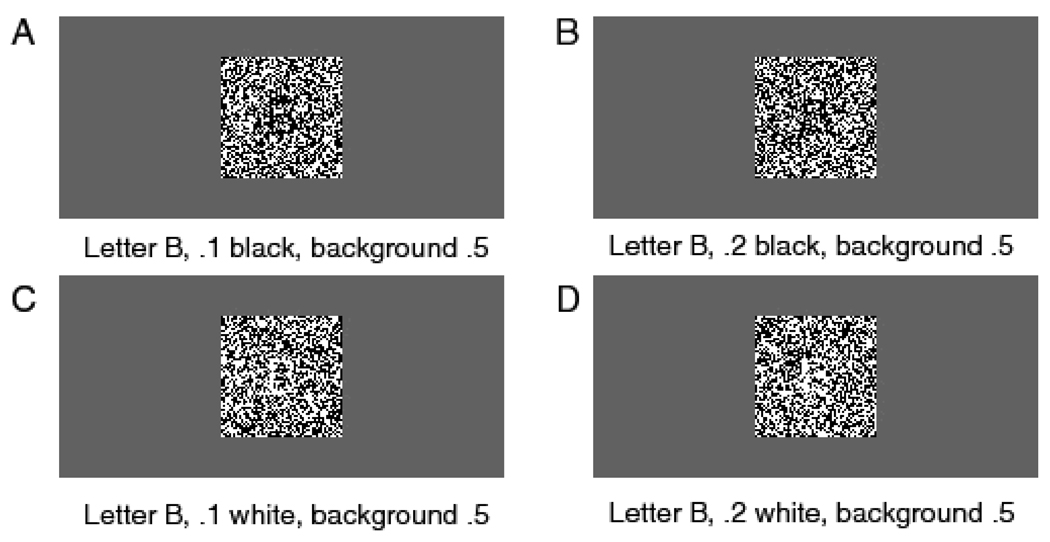
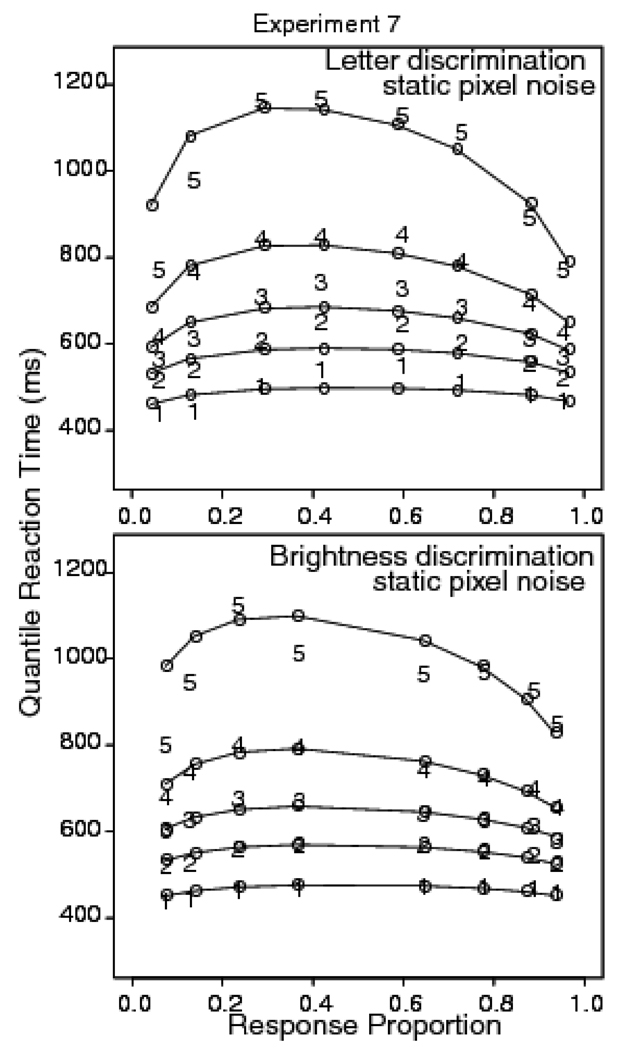
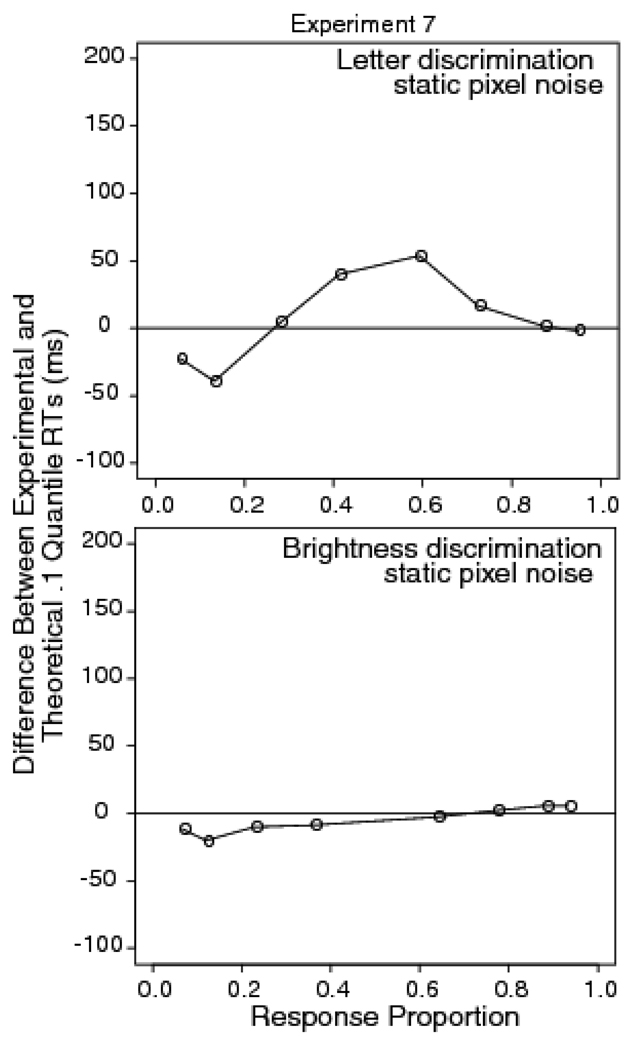
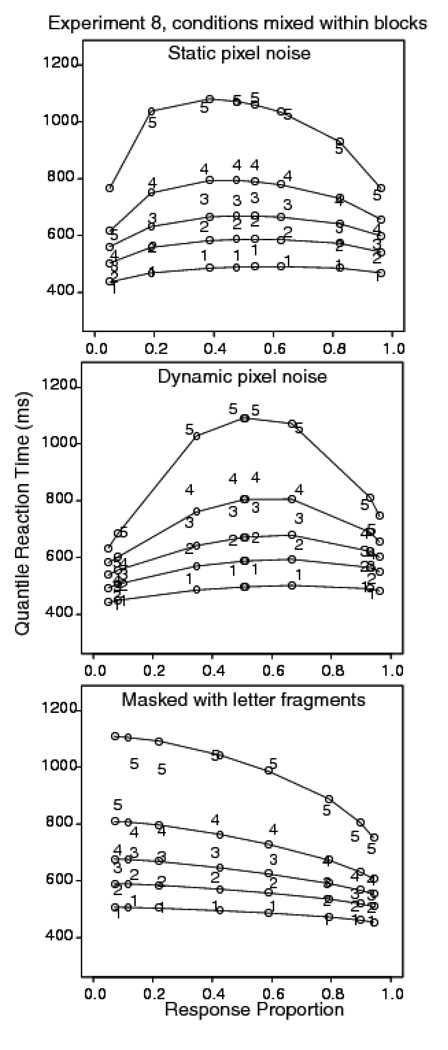
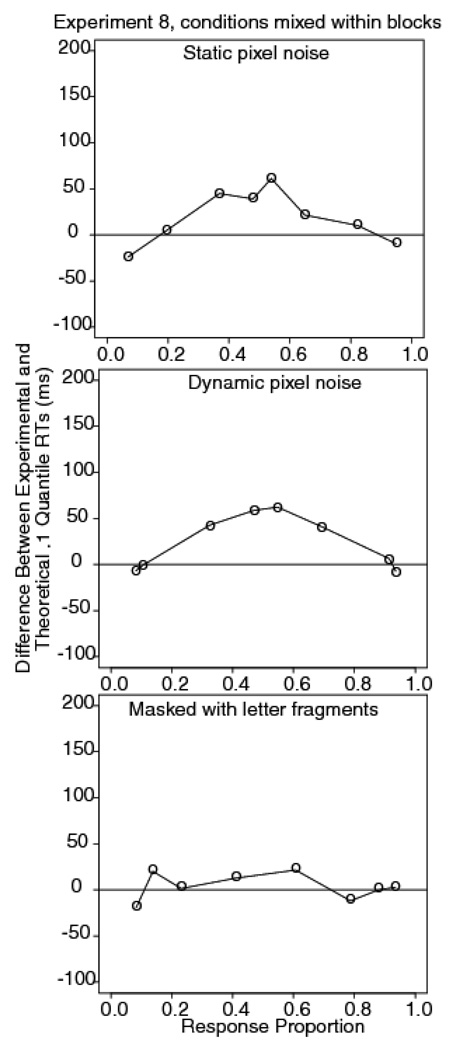
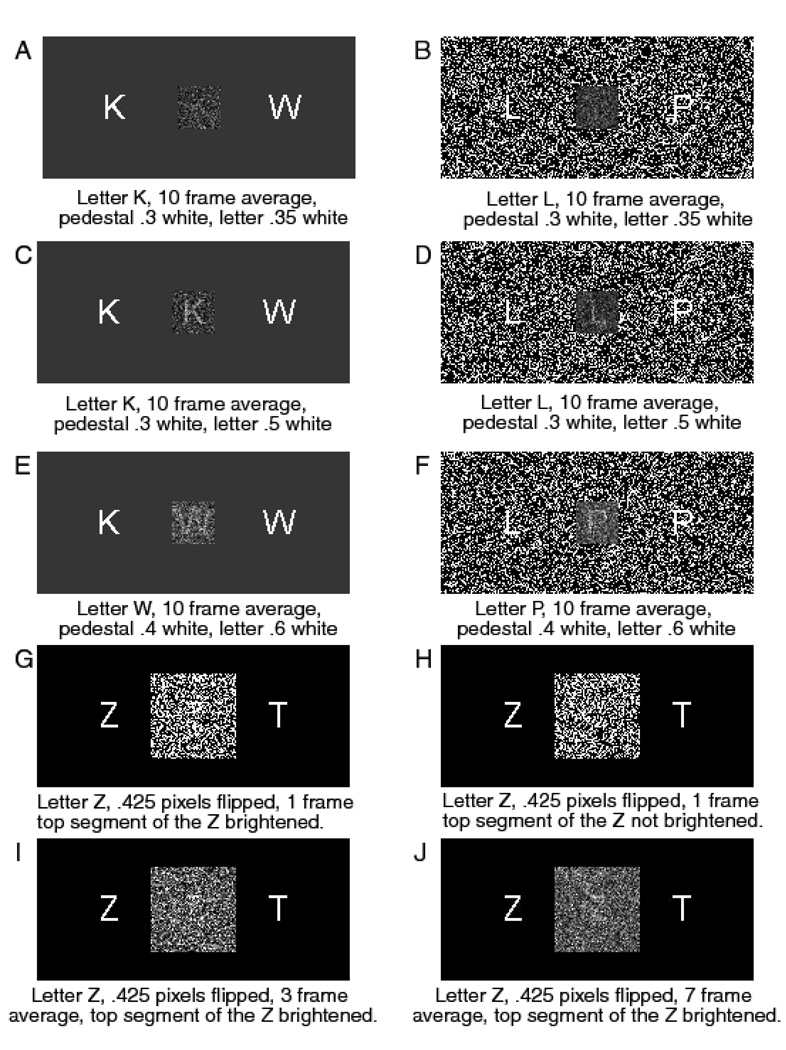
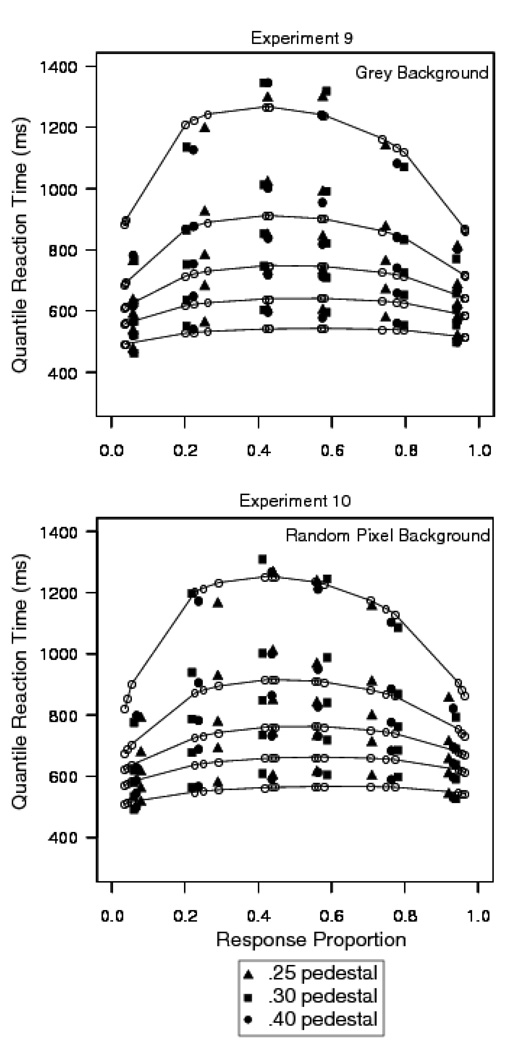
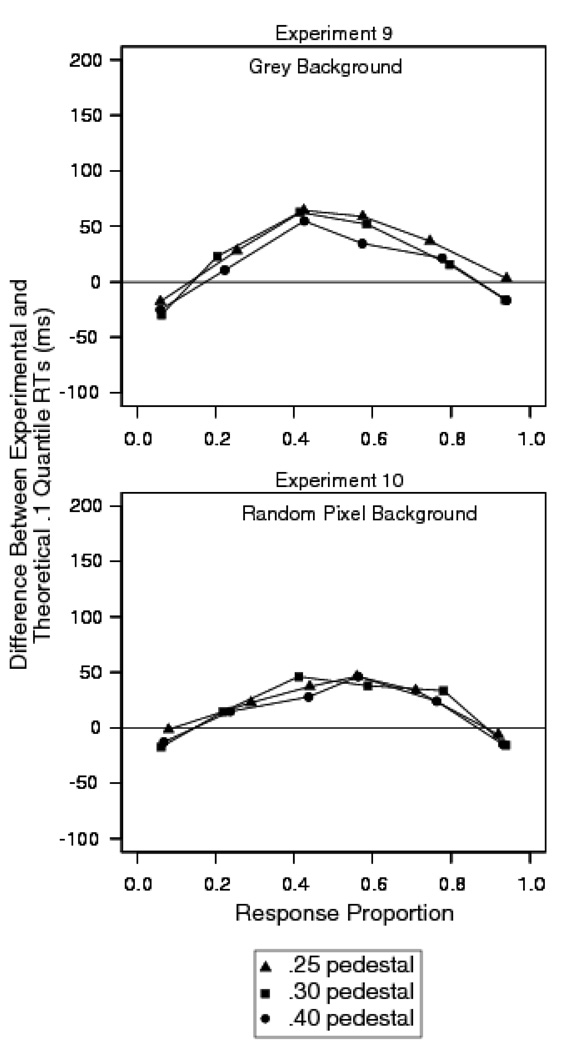
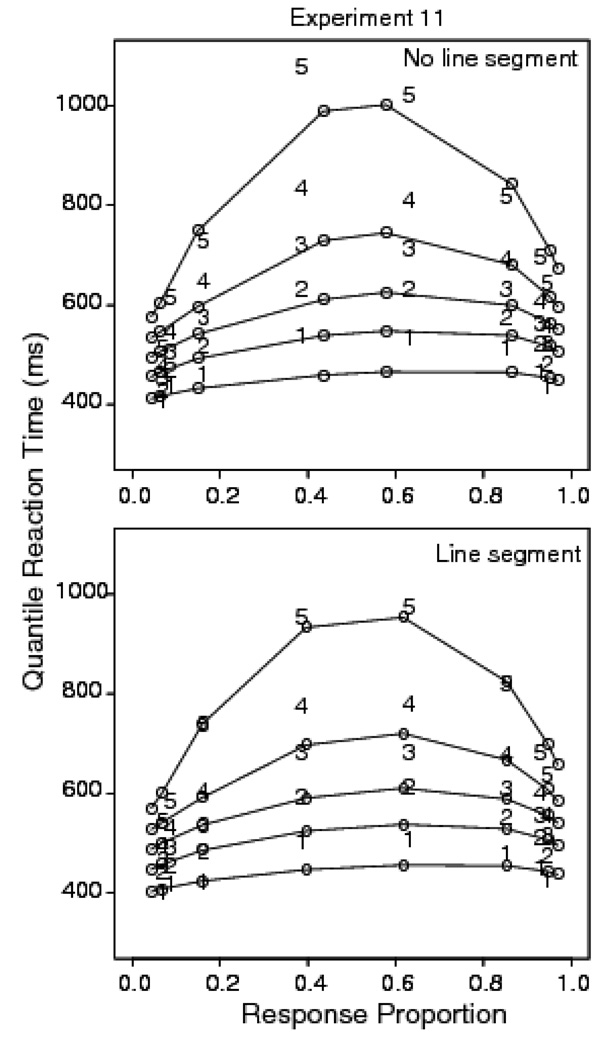
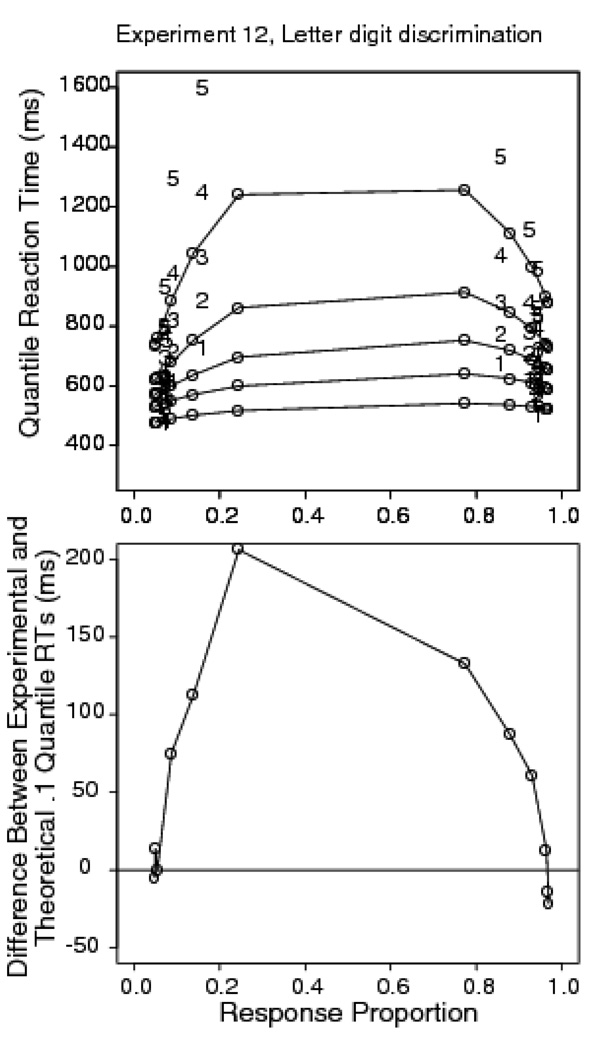
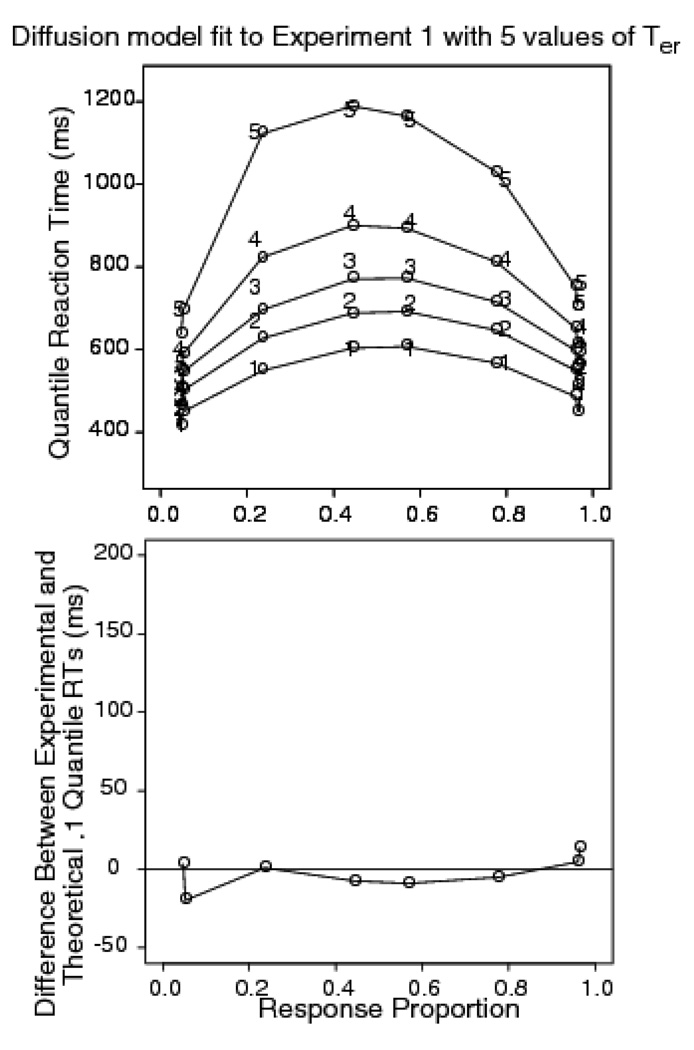
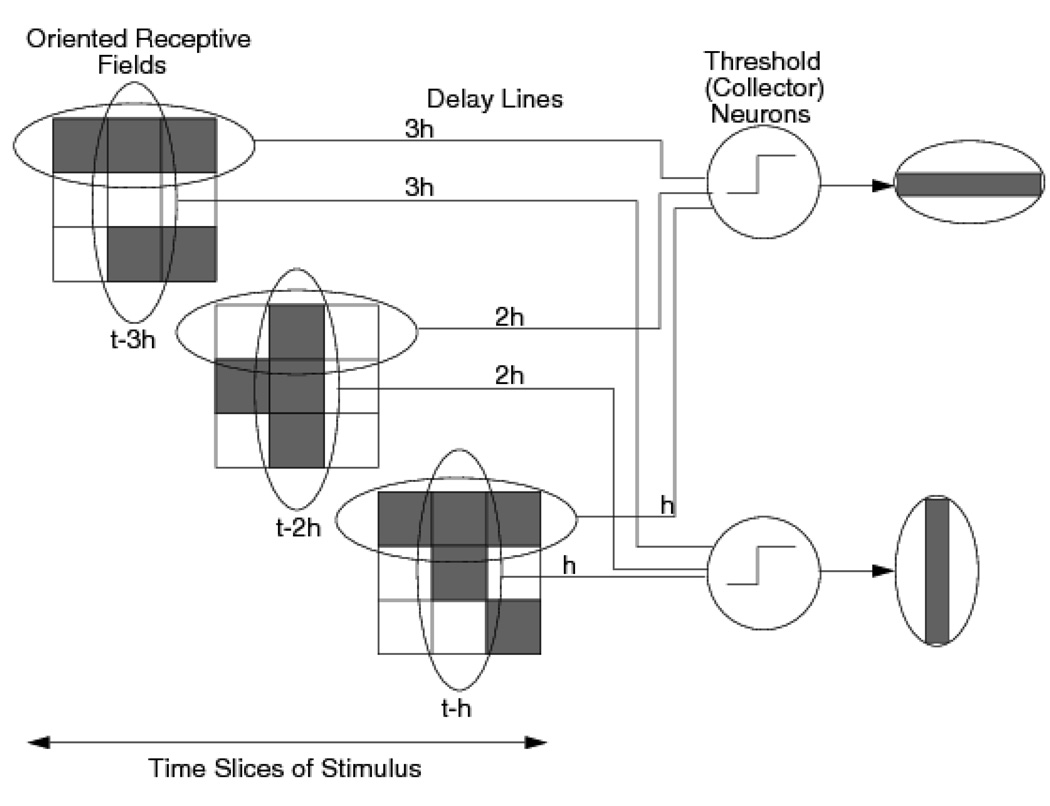
The authors report 9 new experiments and reanalyze 3 published experiments that investigate factors affecting the time course of perceptual processing and its effects on subsequent decision making. Stimuli in letter-discrimination and brightness-discrimination tasks were degraded with static and dynamic noise. The onset and the time course of decision making were quantified by fitting the data with the diffusion model. Dynamic noise and, to a lesser extent, static noise, produced large shifts in the leading edge of the response-time distribution in letter discrimination but had little effect in brightness discrimination. The authors interpret these shifts as changes in the onset of decision making. The different pattern of shifts in letter discrimination and brightness discrimination implies that decision making in the 2 tasks was affected differently by noise. The changes in response-time distributions found with letter stimuli are inconsistent with the hypothesis that noise increases response times to letter stimuli simply by reducing the rate at which evidence accumulates in the decision process. Instead, they imply that noise also delays the time at which evidence accumulation begins. The delay is shown not to be the result of strategic processes or the result of using different stimuli in different tasks. The results imply, rather, that the onset of evidence accumulation in the decision process is time-locked to the perceptual encoding of the stimulus features needed to do the task. Two mechanisms that could produce this time-locking are described.


Figures

Figure 1
Figure 1
An illustration of the diffusion model. The 20 irregularly shaped paths illustrate variability in the process necessary to produce errors and the shapes of RT distributions. The process starts at a point z with drift rate v and terminates when it hits boundaries at 0 or a. The duration of the decision process, D, is added to the duration of stimulus encoding, E, and response output processes, R to give the total decision time. E+R=Ter the nondecision time.
Figure 2
Figure 2
The top panel shows a RT distribution as a frequency polygon, along with a quantile RT distribution with equal area rectangles drawn between the .1, .3, .5, .7, and .9 quantile RTs and rectangles with half the area outside the .1 and .9 quantile RTs. The bottom panel shows a quantile probability plot with the proportion of responses for that condition on the x-axis and quantile RTs plotted as x’s on the y-axis (x’s on the outermost pair, and digits on the innermost pair, with 1=.1 quantile RT, 2=.3 quantile RT, 3=.5 quantile RT, 4=.5 quantile RT, and 5=.9 quantile RT). Equal areas rectangles are drawn between two of the sets of the quantiles to illustrate how to interpret RT distribution shape in the plot (these are comparable to the distribution in the top panel). Two conditions are shown, one with accuracy at .95 with the error proportion .05 and the other with accuracy .7 with the error proportion .3. The correct/ error relationship is illustrated by double ended arrows pointing to the pairs. In the plots of data, digit alone are used to present values of the quantile RTs.
Figure 3
Figure 3
Examples of the stimuli from Experiments 1–4.
Figure 4
Figure 4
Quantile probability plots for Experiment 1 (letter discrimination with dynamic random pixel noise), Experiment 2 (brightness discrimination with dynamic random pixel noise), and Experiment 3 (letter discrimination with static random pixel noise). The digits 1–5 represent the quantile RTs (as in Figure 2) from the data, and the circles are the predicted values of the quantile RTs from fits of the diffusion model.
Figure 5
Figure 5
Difference between experimental and diffusion model fit for the .1 quantile RTs for Experiment 1 (letter discrimination with dynamic random pixel noise), Experiment 2 (brightness discrimination with dynamic random pixel noise), and Experiment 3 (letter discrimination with static random pixel noise).
Figure 6
Figure 6
Quantile probability plots for Experiment 4 (letter discrimination with masking, from Experiment 1, young subjects, accuracy condition from Thapar et al., 2003), Experiment 5 (brightness discrimination with masking, from Experiment 1, young subjects, accuracy condition from Ratcliff et al., 2003), and Experiment 6 (motion discrimination from Experiment 1, Ratcliff & McKoon, 2008).
Figure 7
Figure 7
Difference between experimental and diffusion model fit for the .1 quantile RTs for Experiment 4 (letter discrimination with masking, from Experiment 1, young subjects, accuracy condition from Thapar et al., 2003), Experiment 5 (brightness discrimination with masking, from Experiment 1, young subjects, accuracy condition from Ratcliff et al., 2003), and Experiment 6 (motion discrimination from Experiment 1, Ratcliff & McKoon, 2008).
Figure 8
Figure 8
Examples of stimuli for Experiment 7.
Figure 9
Figure 9
Quantile probability plots for Experiment 7. The stimuli were letters in dynamic random pixel noise and different blocks of trials had subjects judge the brightness of the letter (it could be brighter or darker than the background) or which of the two letter choices was presented.
Figure 10
Figure 10
Difference between experimental and diffusion model fit for the .1 quantile RTs for Experiment 7. The stimuli were letters in dynamic random pixel noise and different blocks of trials had subjects judge the brightness of the letter (it could be brighter or darker than the background) or which of the two letter choices was presented.
Figure 11
Figure 11
Quantile probability plots for Experiment 8. Three tasks were randomly mixed within blocks, letter discrimination with dynamic random pixel noise, letter discrimination with static random pixel noise, and letter discrimination with masking.
Figure 12
Figure 12
Difference between experimental and diffusion model fit for the .1 quantile RTs for Experiment 8. Three tasks were randomly mixed within blocks, letter discrimination with dynamic random pixel noise, letter discrimination with static random pixel noise, and letter discrimination with masking.
Figure 13
Figure 13
Examples of stimuli for Experiments 9, 10, and 11.
Figure 14
Figure 14
Quantile probability plots for Experiments 9 (letter discrimination with dynamic random pixel noise) with a grey background and Experiment 10 (letter discrimination with dynamic random pixel noise) with a random pixel background.
Figure 15
Figure 15
Difference between experimental and diffusion model fit for the .1 quantile RTs for Experiments 9 (letter discrimination with dynamic random pixel noise) with a grey background and Experiment 10 (letter discrimination with dynamic random pixel noise) with a random pixel background.
Figure 16
Figure 16
Quantile probability plots for Experiment 11 for letter discrimination with random pixel noise and no brightened line segment (top panel) and a brightened line segment for three 16.67 ms frames.
Figure 17
Figure 17
Difference between experimental and diffusion model fit for the .1 quantile RTs for Experiment 11 for letter discrimination with random pixel noise and no brightened line segment (top panel) and a brightened line segment for three 16.67 ms frames.
Figure 18
Figure 18
Quantile probability plot and a plot of the difference between experimental and diffusion model fit for the .1 quantile RTs for Experiment 12, letter digit discrimination with dynamic random pixel noise.
Figure 19
Figure 19
Fit of the diffusion model to the data from Experiment 1, letter discrimination with dynamic random pixel noise.
Figure 20
Figure 20
Plots of quantile RTs against quantile RTs for correct responses for all the experiments. Experiment 5 has only half the conditions plotted. In each case, the quantiles for the less accurate conditions are plotted against the quantiles for the most accurate condition.
Figure 21
Figure 21
Delay line coding model. Activity in a random pixel array is coded by oriented receptive fields. Collector neurons receive inputs via delay lines from time slices t - h, t - 2h, t - 3h, etc. The neurons fire at time t only if the sum of their inputs exceeds a threshold. Delay line coding detects the presence of persistent structure in the stimulus while suppressing transient structure. In the example, the two collector neurons receive inputs from receptive fields that detect the crossbar and the upright of a capital T, respectively. This coding scheme also produces spatiotemporal summation. Features can be detected even when degraded (represented here by one of the three locations in the receptive field left unfilled) in the presence of temporal correlation in the input. In this example, if the two collector neurons have a threshold of 7 units of input, both will fire in response to the three stimulus frames shown. The model assumes that the rate of neural firing determines the rate at which a stable perceptual representation of the stimulus is formed.

Similar articles

Cited by

References

    1. Busemeyer JR, Townsend JT. Fundamental derivations from decision field theory. Mathematical Social Sciences. 1992;23:255–282.
    1. Donders FC. On the speed of mental processes. In: Koster WG, translator; Koster WG, editor. Attention and Performance II. Amsterdam: North-Holland: 1969. pp. 412–431. (Original work published in Onderzoekingen Gedann in het Psycologisch Laboratorium der Utrechtsche Hoogeschool, Tweede reeks, 1868–1869, II, pp. 92–120.).
    1. Gomez P, Ratcliff R, Perea M. A model of the go/no-go task. Journal of Experimental Psychology: General. 2007;136:347–369. - PMC - PubMed
    1. Gould IC. Unpublished B.Sc. Honors thesis. The University of Melbourne; 2004. Attentional mechanisms in visual signal detection: Signal enhancement or uncertainty reduction.
    1. Gould IC, Wolfgang BJ, Smith PL. Spatial uncertainty explains endogenous and exogenous cuing effects in visual signal detection. Journal of Vision. 2007;7:1–17. - PubMed

Publication types