. 2010 Oct;16(5):1135-44.
doi: 10.1089/ten.TEC.2009.0438.

Rat parotid gland cell differentiation in three-dimensional culture

Affiliations

Rat parotid gland cell differentiation in three-dimensional culture

Olga J Baker et al. Tissue Eng Part C Methods. 2010 Oct.

Abstract

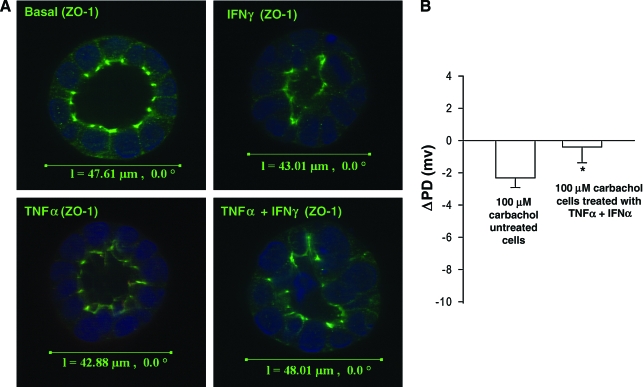
The use of polarized salivary gland cell monolayers has contributed to our understanding of salivary gland physiology. However, these cell models are not representative of glandular epithelium in vivo, and, therefore, are not ideal for investigating salivary epithelial functions. The current study has developed a three-dimensional (3D) cell culture model for rat Par-C10 parotid gland cells that forms differentiated acinar-like spheres on Matrigel. These 3D Par-C10 acinar-like spheres display characteristics similar to differentiated acini in salivary glands, including cell polarization, tight junction (TJ) formation required to maintain transepithelial potential difference, basolateral expression of aquaporin-3 and Na+/K+/2Cl- cotransporter-1, and responsiveness to the muscarinic receptor agonist carbachol that is decreased by the anion channel blocker diphenylamine-2-carboxylic acid or chloride replacement with gluconate. Incubation of the spheres in the hypertonic medium increased the expression level of the water channel aquaporin-5. Further, the proinflammatory cytokines tumor necrosis factor-alpha and interferon-gamma induced alterations in TJ integrity in the acinar-like spheres without affecting individual cell viability, suggesting that cytokines may affect salivary gland function by altering TJ integrity. Thus, 3D Par-C10 acinar-like spheres represent a novel in vitro model to study physiological and pathophysiological functions of differentiated acini.


Figures

FIG. 1.
FIG. 1.
(A) Structure of major salivary glands. Salivary glands consist of acinar and ductal cells; primary saliva is formed in acinar cells and modified as it passes through the ducts. (B) Fluid secretion model for salivary acini. Activation of basolateral M3 muscarinic receptors initiates signaling cascades that stimulate apical Ca2+-dependent Cl channels. The stimulated efflux of Cl produces a transepithelial potential difference (PD) that drives Na+ transport and water diffusion across the tight junction (TJ; green rectangles), creating a plasma-like primary secretion in the lumen. Transepithelial water transport is mediated by paracellular and transcellular pathways. Salivary acini also express P2Y2 nucleotide receptors at the apical surface whose activation also increases intracellular free Ca2+ concentration ([Ca2+]i). Inset (adapted from Aktories and Barbieri) indicates that the TJ proteins occludin, claudins, and JAMs are linked to the cytoskeleton via cytoplasmic ZO-1 proteins. (C) Par-C10 cells form three-dimensional (3D) acinar-like spheres. Par-C10 cells grown on growth-factor-reduced (GFR) Matrigel for 2 days were analyzed for sphere formation using immunofluorescence confocal microscopy with phalloidin (green). Serial x–y and x–z plane confocal projections were taken to generate a 3D image using a Carl Zeiss 510 confocal microscope. Images of confocal z-sections of a sphere (from 0 to 40.5 μm) are shown. Sphere diameter taken at the widest point of the x–y plane (I) is shown in μm. Color images available online at www.liebertonline.com/ten.
FIG. 2.
FIG. 2.
Three-dimensional Par-C10 acinar-like spheres express markers of cell differentiation. Protein expression was detected using immunofluorescence microscopy with goat anti-mouse occludin (A, D; red), rabbit anti-ZO-1 (B, D; green), rabbit anti-claudin-3 (E, G; green), rabbit anti-M3 receptor (I, K; green), rabbit anti-AQP3 (M, O; red), rabbit anti-ATP7A (Q, S; green), rabbit anti-Na+/K+-ATPase (U, W; green), and rabbit anti-Na+/K+/2Cl cotransporter-1 (NKCC1) (Y, Z1, green) followed by Hoechst nuclear stain (C, D, F, G, J, K, N, O, R, S, V, W, Z, Z1; blue) and phalloidin staining (H, K, P, S, T, W, X, Z1; red). Fluorescence of GFP-P2Y2 receptor (L; green) is also shown. Images were obtained and analyzed using a Carl Zeiss 510 confocal microscope. Sphere diameter taken at the widest point of the x–y plane (I) is shown in μm. Color images available online at www.liebertonline.com/ten.
FIG. 2.
FIG. 2.
Three-dimensional Par-C10 acinar-like spheres express markers of cell differentiation. Protein expression was detected using immunofluorescence microscopy with goat anti-mouse occludin (A, D; red), rabbit anti-ZO-1 (B, D; green), rabbit anti-claudin-3 (E, G; green), rabbit anti-M3 receptor (I, K; green), rabbit anti-AQP3 (M, O; red), rabbit anti-ATP7A (Q, S; green), rabbit anti-Na+/K+-ATPase (U, W; green), and rabbit anti-Na+/K+/2Cl cotransporter-1 (NKCC1) (Y, Z1, green) followed by Hoechst nuclear stain (C, D, F, G, J, K, N, O, R, S, V, W, Z, Z1; blue) and phalloidin staining (H, K, P, S, T, W, X, Z1; red). Fluorescence of GFP-P2Y2 receptor (L; green) is also shown. Images were obtained and analyzed using a Carl Zeiss 510 confocal microscope. Sphere diameter taken at the widest point of the x–y plane (I) is shown in μm. Color images available online at www.liebertonline.com/ten.
FIG. 3.
FIG. 3.
Hypersomotic stress upregulates AQP5 expression in Par-C10 cells grown on Matrigel. Lysates were prepared from Par-C10 cells grown on GFR Matrigel, and AQP5 expression in serum-free Dulbecco's modified Eagle's medium–Ham's F12 medium with (hypertonic treatment) or without (basal) 200 mM sorbitol was detected by Western blot analysis, as described in Materials and Methods section. The experiment was repeated at least thrice with similar results.
FIG. 4.
FIG. 4.
Three-dimensional Par-C10 acinar-like spheres exhibit changes in PD in response to the muscarinic receptor agonist carbachol. (A) (1) Par-C10 acinar-like spheres grown on GFR Matrigel were untreated or pretreated with 100 μM diphenylamine-2-carboxylic acid (DIDS) or cultured with the medium in which chloride was replaced with gluconate and placed on the stage of a stereomicroscope, and the lumen of the sphere was penetrated with a 20–30 MΩ glass microelectrode filled with 0.3 M KCl (tip diameter ∼1 μm); (2) transepithelial PD in spheres was recorded using an axoclamp 2A intracellular amplifier (Molecular Devices); and (3) changes in transepithelial PD in response to carbachol or medium were determined. (B) Changes in transepithelial PD (ΔPD) of Par-C10 acinar-like spheres grown on GFR Matrigel are shown in response to 10 or 100 μM carbachol in the presence or absence of DIDS or in the medium in which chloride was replaced with gluconate. Data are representative of results from three or more measurements, where asterisk (*) indicates significant differences (p < 0.001) for a given group, as compared with 100 μM carbachol alone, using one-way analysis of variance followed by pair-wise post hoc Tukey's t-test. (C) Representative traces for each condition shown in (B). Color images available online at www.liebertonline.com/ten.
FIG. 5.
FIG. 5.
Tumor necrosis factor-α (TNFα) and/or interferon-γ (IFNγ) treatment alter ZO-1 distribution at TJs of 3D Par-C10 acinar-like spheres without affecting carbachol-induced calcium signaling. (A) Two-day-old 3D Par-C10 acinar-like spheres were treated with TNFα (10 ng/mL) and/or IFNγ (10 ng/mL) for 48 h and subjected to immunofluorescence using rabbit anti-ZO-1 antibody followed by AlexaFluor 488–conjugated goat anti-rabbit immunoglobulin G antibody (green) and Hoechst nuclear stain (blue). The x–y images were obtained and analyzed using a Carl Zeiss 510 confocal microscope. Sphere diameter taken at the widest point of the x–y plane (I) is shown in μm. (B) Par-C10 acinar-like spheres were treated with or without TNFα (10 ng/mL) and/or IFNγ (10 ng/mL) for 48 h. Then, spheres were stimulated with carbachol (100 μM) and changes (Δ) in PD were determined, as described in Figure 4A. Data are expressed as means ± SE where *p < 0.05 indicates significant differences from untreated cells. (C) Continuous carbachol (100 μM)–induced increases in [Ca2+]i in Par-C10 acinar-like spheres were monitored, as described in Materials and Methods section. (D) Par-C10 acinar-like spheres were treated with or without TNFα (10 ng/mL) and/or IFNγ (10 ng/mL) for 48 h. Then, spheres were stimulated with carbachol (100 μM) and changes (Δ) in [Ca2+]i were monitored, as described in Materials and Methods section. Changes in [Ca2+]i are expressed as the peak carbachol-induced increase in [Ca2+]i minus basal [Ca2+]i. Data are expressed as the mean ± standard error of the mean of triplicate results from three experiments. Color images available online at www.liebertonline.com/ten.
FIG. 5.
FIG. 5.
Tumor necrosis factor-α (TNFα) and/or interferon-γ (IFNγ) treatment alter ZO-1 distribution at TJs of 3D Par-C10 acinar-like spheres without affecting carbachol-induced calcium signaling. (A) Two-day-old 3D Par-C10 acinar-like spheres were treated with TNFα (10 ng/mL) and/or IFNγ (10 ng/mL) for 48 h and subjected to immunofluorescence using rabbit anti-ZO-1 antibody followed by AlexaFluor 488–conjugated goat anti-rabbit immunoglobulin G antibody (green) and Hoechst nuclear stain (blue). The x–y images were obtained and analyzed using a Carl Zeiss 510 confocal microscope. Sphere diameter taken at the widest point of the x–y plane (I) is shown in μm. (B) Par-C10 acinar-like spheres were treated with or without TNFα (10 ng/mL) and/or IFNγ (10 ng/mL) for 48 h. Then, spheres were stimulated with carbachol (100 μM) and changes (Δ) in PD were determined, as described in Figure 4A. Data are expressed as means ± SE where *p < 0.05 indicates significant differences from untreated cells. (C) Continuous carbachol (100 μM)–induced increases in [Ca2+]i in Par-C10 acinar-like spheres were monitored, as described in Materials and Methods section. (D) Par-C10 acinar-like spheres were treated with or without TNFα (10 ng/mL) and/or IFNγ (10 ng/mL) for 48 h. Then, spheres were stimulated with carbachol (100 μM) and changes (Δ) in [Ca2+]i were monitored, as described in Materials and Methods section. Changes in [Ca2+]i are expressed as the peak carbachol-induced increase in [Ca2+]i minus basal [Ca2+]i. Data are expressed as the mean ± standard error of the mean of triplicate results from three experiments. Color images available online at www.liebertonline.com/ten.

Similar articles

Cited by

References

    1. Melvin J.E. Yule D. Shuttleworth T. Begenisich T. Regulation of fluid and electrolyte secretion in salivary gland acinar cells. Annu Rev Physiol. 2005;67:445. - PubMed
    1. Martinez J.R. Cassity N. Salivary secretion induced from isolated, perfused rat submandibular glands by sympathomimetic agents. Arch Oral Biol. 1983;28:1101. - PubMed
    1. Martinez J.R. Holzgreve H. Frick A. Micropuncture study of submaxillary glands of adult rats. Pflugers Arch Gesamte Physiol Menschen Tiere. 1966;290:124. - PubMed
    1. Nusrat A. Turner J.R. Madara J.L. Molecular physiology and pathophysiology of tight junctions. IV. Regulation of tight junctions by extracellular stimuli: nutrients, cytokines, and immune cells. Am J Physiol Gastrointest Liver Physiol. 2000;279:G851. - PubMed
    1. Shin K. Fogg V.C. Margolis B. Tight junctions and cell polarity. Annu Rev Cell Dev Biol. 2006;22:207. - PubMed

Publication types