. 2010 Feb 1:9:8.
doi: 10.1186/1475-2840-9-8.

Intracellular Ca2+ regulating proteins in vascular smooth muscle cells are altered with type 1 diabetes due to the direct effects of hyperglycemia

Affiliations

Intracellular Ca2+ regulating proteins in vascular smooth muscle cells are altered with type 1 diabetes due to the direct effects of hyperglycemia

Yvonne M Searls et al. Cardiovasc Diabetol. .

Abstract

Background: Diminished calcium (Ca2+) transients in response to physiological agonists have been reported in vascular smooth muscle cells (VSMCs) from diabetic animals. However, the mechanism responsible was unclear.

Methodology/principal findings: VSMCs from autoimmune type 1 Diabetes Resistant Bio-Breeding (DR-BB) rats and streptozotocin-induced rats were examined for levels and distribution of inositol trisphosphate receptors (IP3R) and the SR Ca2+ pumps (SERCA 2 and 3). Generally, a decrease in IP3R levels and dramatic increase in ryanodine receptor (RyR) levels were noted in the aortic samples from diabetic animals. Redistribution of the specific IP3R subtypes was dependent on the rat model. SERCA 2 was redistributed to a peri-nuclear pattern that was more prominent in the DR-BB diabetic rat aorta than the STZ diabetic rat. The free intracellular Ca2+ in freshly dispersed VSMCs from control and diabetic animals was monitored using ratiometric Ca2+ sensitive fluorophores viewed by confocal microscopy. In control VSMCs, basal fluorescence levels were significantly higher in the nucleus relative to the cytoplasm, while in diabetic VSMCs they were essentially the same. Vasopressin induced a predictable increase in free intracellular Ca2+ in the VSMCs from control rats with a prolonged and significantly blunted response in the diabetic VSMCs. A slow rise in free intracellular Ca2+ in response to thapsigargin, a specific blocker of SERCA was seen in the control VSMCs but was significantly delayed and prolonged in cells from diabetic rats. To determine whether the changes were due to the direct effects of hyperglycemica, experiments were repeated using cultured rat aortic smooth muscle cells (A7r5) grown in hyperglycemic and control conditions. In general, they demonstrated the same changes in protein levels and distribution as well as the blunted Ca2+ responses to vasopressin and thapsigargin as noted in the cells from diabetic animals.

Conclusions/significance: This work demonstrates that the previously-reported reduced Ca2+ signaling in VSMCs from diabetic animals is related to decreases and/or redistribution in the IP3R Ca2+ channels and SERCA proteins. These changes can be duplicated in culture with high glucose levels.


Figures

Figure 1
Figure 1
Intracellular Ca2+ Transients were Altered by Diabetes. Whole cell vasopressin and thapsigargin-induced Ca2+ transients were altered by diabetes in VSMC from the aorta and femoral artery. Vasopressin was applied to VSMCs from the aorta (A) or femoral artery (B) from DR-BB rats at time 0. The time of the thapsigargin application is shown with the arrow (TSG). In both cases the vasopressin-induced Ca2+ transients were blunted in amplitude and thapsigargin responses were delayed in cells from diabetic rats. For all figures, blue shades indicate data of cells from diabetic and control rats; green shades indicate data from cultured A7r5 cells grown in various glucose concentrations.
Figure 2
Figure 2
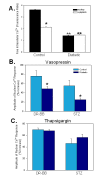
Peak Ca2+ Transients were Blunted in Diabetes. A) Separate analysis of the nuclear and cytoplasmic compartments indicated that most of the diabetes-induced changes in the Ca2+ transients occurred due to changes in the nuclear compartment. Ratiometric Ca2+-sensitive fluorophores demonstrated the decline in the resting Ca2+ levels with diabetes that were especially dramatic in the nuclear compartment. The figure illustrates results of cells from DR-BB rats. P < 0.05. * indicates a significant difference in the fluorescence levels between the nuclear and cytoplasmic compartments in VSMC from control animals. ** indicates a significant decline in the resting Ca2+ concentration in cells from diabetic animals compared to the control. There was no statistical difference noted in the nucleus and cytoplasm within cells from diabetic aorta. B) The amplitude of the vasopressin-induced nuclear Ca2+ transients declined with diabetes in both diabetic animal models. * indicates a significant difference between the control and diabetic groups, p < 0.05. C) There was no significant change in the amplitude of the thapsigargin-induced nuclear Ca2+ transients in either diabetic animal model. * indicates p < 0.05. For Figure 2, n = 39 and 42 cells from control and diabetic STZ rats, respectively. n = 24 and 22 cells from control and diabetic DR-BB rats, respectively.
Figure 3
Figure 3
Peak Ca2+ Transients are Blunted in Response to Hyperglycemia in Culture. A) Basal intracellular Ca2+ concentrations increased in VSMCs when grown in high glucose conditions as opposed to low or medium glucose (n = 30 cells/group). * Indicates p < 0.0001. B) Stimulation of cells with vasopressin (time 0) and thapsigargin (TSG, arrow) illustrated blunted responses in cells grown in high glucose (n = 29 cells). C) The plot of the amplitude of the response to each agonist (normalized for the different basal Ca2+ levels) illustrates the differences in the peak responses to vasopressin and thapsigargin (* indicates p < 0.05; n = 97 cells in low glucose and 138 in high glucose conditions).
Figure 4
Figure 4
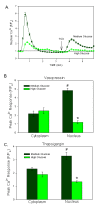
Nuclear Ca2+ Transients are Altered by High Glucose. A) Nuclear Ca2+ responses to vasopressin and thapsigargin (TSG) in A7r5 cells grown in medium glucose or high glucose conditions are shown. Both the vasopressin (added at time 0) and the TSG (added at the arrow) responses were blunted in the nuclei of cells grown in high glucose. (n = 15 cells/group, p < 0.0001) B) The mean peak amplitude of the Ca2+ response to vasopressin did not change significantly in the cytoplasm when cells were grown in high glucose. However, the nuclear compartment showed significant reduction of the vasopressin response in high glucose (n = 94 cells) versus medium glucose (n = 37). (p < 0.001; indicated by *) C) The mean peak amplitude of the thapsigargin (TSG) response did not change significantly in the cytoplasmic compartment with high glucose exposure, but was significantly blunted in the nuclear compartment (n = 37). (p < 0.001; indicated by *).
Figure 5
Figure 5
High Amplitude Spontaneous Nuclear Ca2+ Oscillations Occur in High Glucose. In high glucose, A7r5 cells (n = 42) often demonstrated large spontaneous nuclear Ca2+ transients. Spontaneous nuclear Ca2+ activity in three individual cells, resting in high glucose conditions, depicts high amplitude oscillations in two cells represented by black and red lines (1 and 3 oscillations, respectively). In the same field, some of the cells failed to elicit any spontaneous oscillations as indicated with the green line.
Figure 6
Figure 6
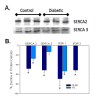
Ca2+ Regulatory Protein Levels Change with Diabetes. A) Representative immunoblots for the SERCA proteins from control and diabetic DR-BB rat aorta. Each lane was loaded with protein from an individual animal. B) Plot illustrates the decline in aortic protein levels of the SR Ca2+ ATPases (SERCA2 and SERCA3) and the IP3 receptors (type 1 and 2). Diabetes corresponded with a reduction in protein levels for all Ca2+ regulatory proteins in both the STZ and DR-BB animal models, with one exception. The level of SERCA3 did not decline significantly with diabetes in the STZ model. * indicates a significant decline from non-diabetic rats, p < 0.05
Figure 7
Figure 7
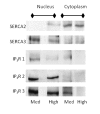
Ca2+ Regulatory Protein Levels Altered in Cultured VSMC Grown in High Glucose. Immunoblots of the SERCA and IP3R isoforms in cytoplasmic and nuclear extracts from A7r5 cells grown in high or medium glucose concentrations are shown. SERCA2 protein levels remained steady in the cytoplasm, but an increase was observed in the nuclear extract from cells in high glucose. SERCA3 in the cytoplasm was detected at equally low levels in either glucose concentration. Nuclear SERCA3 levels were reduced with hyperglycemic treatment. All IP3Rs showed a reduction in protein levels in response to high glucose.
Figure 8
Figure 8
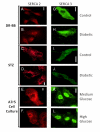
SERCA2 and SERCA3 Shift to a More Nuclear and Perinuclear Distribution in Conditions of Diabetes and Hyperglycemia. Immunofluorescence shows the distribution of proteins in cells from control and diabetic rats from both the DR-BB (A, B, G, and H) and STZ diabetic model (C, D, I, and J), and in A7r5 cells cultured with medium (E and K) or high glucose concentrations (F and L). Examples show a more localized perinuclear and nuclear distribution of SERCA2 in both animal models when diabetes was developed. In addition there was a decrease in the total fluorescence for SERCA3 in both animal models. Hyperglycemia also induced a redistribution of SERCA2 and SERCA3 to the nucleus.
Figure 9
Figure 9
Marker for SR Protein Levels Are Not Altered with Diabetes. Fluorescence values from cells stained for SR area, using Brefeldin A as a marker, showed no differences between cells from control of diabetic animals, regardless of the type of diabetic animal model.
Figure 10
Figure 10
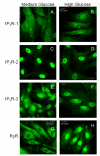
IP3R and RyR Protein Distribution Changes with High Glucose Treatment. Immunofluorescence experiments picture the relative location of each IP3R isoform in the cells grown in medium and high glucose. Few changes were noted in the distribution of IP3R-1 (A and B). There was a loss in fluorescence in IP3R-2 (C and D) and IP3R-3 (E and F) with high glucose treatment are shown. Cells grown in medium glucose conditions displayed primarily cytoplasmic staining of the RyR with perinuclear localization (G). RyR in cells grown in high glucose exhibited strong nuclear localization (H).

Similar articles

Cited by

References

    1. Preis S, Hwang S, Coady S, Pencina M, D'Agostino RS, Savage P, Levy D, Fox C. Trends in all-cause and cardiovascular disease mortality among women and men with and without diabetes mellitus in the Framingham Heart Study, 1950 to 2005. Circulation. 2009;119:1728–1735. doi: 10.1161/CIRCULATIONAHA.108.829176. - DOI - PMC - PubMed
    1. Soedamah-Muthu S, Stehouwer C. Cardiovascular disease morbidity and mortality in patients with type 1 diabetes mellitus: management strategies. Treat Endocrinol. 2005;4:75–86. doi: 10.2165/00024677-200504020-00002. - DOI - PubMed
    1. Aronson D. Hyperglycemia and the pathobiology of diabetic complications. Adv Cardiol. 2008;45:1–16. full_text. - PubMed
    1. Laing S, Swerdlow A, Slater S, Burden A, Morris A, Waugh N, Gatling W, Bingley P, Patterson C. Mortality from heart disease in a cohort of 23,000 patients with insulin-treated diabetes. Diabetologia. 2003;46:760–765. doi: 10.1007/s00125-003-1116-6. - DOI - PubMed
    1. Luscher T, Creager M, Beckman J, Cosentino F. Diabetes and vascular disease: pathophysiology, clinical consequences, and medical therapy: part II. Circulation. 2003;108:1655–1661. doi: 10.1161/01.CIR.0000089189.70578.E2. - DOI - PubMed

Publication types

MeSH terms