. 2010 Feb 2:9:26.
doi: 10.1186/1476-4598-9-26.

Antimicrobial peptaibols, novel suppressors of tumor cells, targeted calcium-mediated apoptosis and autophagy in human hepatocellular carcinoma cells

Affiliations

Antimicrobial peptaibols, novel suppressors of tumor cells, targeted calcium-mediated apoptosis and autophagy in human hepatocellular carcinoma cells

Mei Shi et al. Mol Cancer. .

Abstract

Background: Hepatocellular carcinoma (HCC) is one of the most common cancers in the world which is highly chemoresistant to currently available chemotherapeutic agents. Thus, novel therapeutic targets are needed to be sought for the successful treatment of HCC. Peptaibols, a family of peptides synthesized non-ribosomally by the Trichoderma species and other fungi, exhibit antibiotic activities against bacteria and fungi. Few studies recently showed that peptaibols exerted cytotoxicity toward human lung epithelial and breast carcinoma cells. However, the mechanism involved in peptaibol-induced cell death remains poorly understood.

Results: Here, we showed that Trichokonin VI (TK VI), a peptaibol from Trichoderma pseudokoningii SMF2, induced growth inhibition of HCC cells in a dose-dependent manner. It did not obviously impair the viability of normal liver cells at lower concentration. Moreover, the suppression of cell viability resulted from the programmed cell death (PCD) with characteristics of apoptosis and autophagy. An influx of Ca2+ triggered the activation of mu-calpain and proceeded to the translocation of Bax to mitochondria and subsequent promotion of apoptosis. On the other hand, typically morphological characteristics consistent with autophagy were also observed by punctate distribution of MDC staining and the induction of LC3-II, including extensive autophagic vacuolization and enclosure of cell organelles by these autophagosomes. More significantly, specific depletion of Bak expression by small RNA interfering (siRNA) could partly attenuate TK VI-induced autophagy. However, siRNA against Bax led to increased autophagy.

Conclusion: Taken together, these findings showed for the first time that peptaibols were novel regulators involved in both apoptosis and autophagy, suggesting that the class of peptaibols might serve as potential suppressors of tumor cells.


Figures
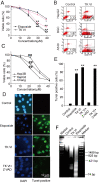
Figure 1
Figure 1
Assessment of cell death and apoptosis induced by TK VI. (A) Cells were treated with TK VI or etoposide, ranging from 10 to 40 μM and incubated in 10% FBS-DMEM complete medium at 37°C for 24 h. Viable cells were measured by MTT assay. Results were expressed as means ± SD of triplicate experiments (each performed in duplicate). Black solid line: HepG2 cells; Red short dash line: BGC cells; Blue dot line: A549 cells. Asterisks indicated values significantly different from cells treated with etoposide. *P < 0.05; **P < 0.01. (B) Cells were treated with 20 μM TK VI for 8 h and then apoptosis were analyzed on a flow cytometer using annexin V/PI staining methods. Data were representative of three independent experiments. Numbers in the respective quadrants indicated the percentage of the cells present in this area. (C) The HepG2, Hep3B and Chang liver cells were incubated with TK VI and detected as described in A. Results were expressed as means ± SD of triplicate experiments (each performed in duplicate). ## indicated values significantly different from Chang liver cells (##P < 0.05). (D) HepG2 cells were treated with 20 μM TK VI or etoposide for 24 h. Then DNA fragmentation in the cells was viewed using fluorescence microscopy. (E) The quantitative analysis of apoptosis in cells was analyzed by FACS using TUNEL staining. Results were expressed as means ± SD of triplicate experiments (each performed in duplicate). Asterisks indicated values significantly different from controls and Z-VAD-treated cells. **P < 0.01. (F) DNA was extracted from HepG2 cells cultured for 36 h with 20 μM TK VI and DNA ladder was detected by agarose gel electrophoresis.
Figure 2
Figure 2
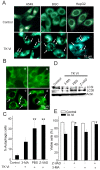
Assessment of cell death and autophagy induced by TK VI. (A) Monodansycadaverine (MDC)-labeled vesicles (indicated by arrows) were induced by TK VI. HepG2, BGC and A549 cells were incubated in DMEM medium (control cells) or treated with 20 μM TK VI and etoposide at 37°C for 24 h. Cells were immediately analyzed by fluorescence. (B) Iimmunocytochemistry for LC3 localization in HepG2 cells treated for 16 h with TK VI alone and combined with Z-VAD-fmk or 3 MA. a: control; b to d: cell treated with TK VI+3-MA, TKVI, and TK VI +Z-VAD-fmk. (C) Cells were treated the same as decribed in (B) and analyzed by acridine orange staining using flow cytometry for autophagy. Results were expressed as means ± SD of triplicate experiments (each performed in duplicate). Asterisks indicated values significantly different from controls and 3-MA-treated cells. **P < 0.01. (D) Cells were treated the same as decribed in (B). Cell lysates were analyzed using Western blotting with anti-LC3 and -actin antibodies. β-actin was used as an internal control to normalize the amount of proteins applied in each lane. (E) HepG2 cells were pretreated with 3-MA or Z-VAD-fmk for 1 h, followed by treatment with 20 μM TK VI for 24 h to determine cell viability using MTT assay. Asterisks indicate values significantly different from cells only treated with TK VI. *P < 0.05.
Figure 3
Figure 3
Assessment of TK VI-induced [Ca2+]c increases using confocal fluo-3 fluorescence imaging. (A)A23187 was a positive control for agitation of [Ca2+]c. (B) and (C), HepG2 cells were loaded with Fluo-3 acetoxymethyl ester and treated with 10 and 20 μM TK VI or Alamethicin (ALam, a classical representative of peptaibols) diluted in PBS alone or containing 2 mM CaCl2. Then cells were examined from 0 to 900 sec for Fluo-3 fluorescence intensity. Original trace of fluorescence intensity as a measure of [Ca2+]c recorded from the cells was marked in the confocal images. TK VI-induced [Ca2+]c increase was assessed by using confocal two-photon fluo-3 fluorescence imaging. (B: right panel and C: middle and right panel). Three cells responded to TK VI stimulation with an increase in fluo-3 fluorescence intensity were used as a measure of [Ca2+]c (indicated with arrows). The graph was labeled with arabic numbers that referred to the images. The images of cells treated with TK VI and Alamethicin (10 μM) diluted in PBS alone were shown in left panels in B and C.
Figure 4
Figure 4
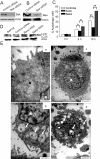
The status of calpain in TK VI-treated cells. (A) Protein samples derived from HepG2 cells treated with 20 μM TK VI for 8 h were analyzed by immunoblotting. The 80-kDa pro-form of μ-calpain appeared as an abundant band, and the cleaved 78-kDa form of the enzyme was visible in some samples just below the pro-form. (B) HepG2 cells were pretreated with BAPTA and SJA6017, followed by 20 μM TK VI for 8 h. Then activation of Bak was detected with activated N-terminal anti-Bak antibody and mitochondria were visualized with red fluorescent protein (Mito-red) by imunofluorescence microscopy. (C) The cells were incubated with TK VI as described in (B). Mitochondria were visualized with red fluorescent protein (Mito-red). The redistribution of Bax was marked with FITC-conjugated anti-mouse and assessed by confocal immunofluorescence. (D) The cells were incubated with TK VI as described in (B). Equal amounts of mitochondrial proteins was isolated from HepG2 cells and then subjected to immunoblot analysis. Cox IV was used as a marker for mitochondrial fraction.
Figure 5
Figure 5
siRNAs against Bax enhanced autophagy in HepG2 cells treated with TK VI. (A) and (B) HepG2 cells were transfected with Bak siRNA and Bax siRNA or control siRNA. After 48 h, the expression of Bak and Bax in interfered and control cells were detected by Western analysis. (C) Cells were treated with 20 μM TK VI for indicated time and then autophagy was analyzed using flow cytometry with acridine orange dyeing. Asterisks indicated values significantly different from Bak siRNA cells. *P < 0.05; **P < 0.01. (D) Cells were incubated with 20 μM TK VI for the 16 h. Cell lysates were analyzed using Western blotting with anti-LC3. (E) Morphological changes of autophagic cell death at 24 h of TK VI exposure. a: Control cells; b: Control siRNA cells treated with 20 μM TK VI. c and d: Bak siRNA and Bax siRNA cells treated with 20 μM TK VI, respectively. N, Nucleus; ER, endoplasmic reticulum; M, mitochondria; V, vacuole. Extensive cytoplasmic vacuolization was seen in TK VI-treated cells (indicated by arrows). The images with high magnification showed that the autophagic vacuoles contained electron dense material and degraded subcellular organelles. Bars represented 1.4 μm (a), 0.8 μm (b), 0.5 μm (c, d).
Figure 6
Figure 6
The requirement of translocation of Bax in TK VI-induced apoptotic cell death. (A) HepG2 cells were treated with 20 μM TK VI for 8 h, or pretreated with calpain inhibitor (SJA6017, 100 μM) and chelators of calcium (BAPTA acetoxymethyl ester, 10 mM). Subsequently, cells were assessed for the exposure of PS with annexin V staining and for viability with PI exclusion by flow cytometry (one representative of three similar experiments). Numbers in the respective quadrants indicated the percentage of the cells present in this area. (B) and (C) Apoptotic cells and dissipation of ΔΨm were quantified by FACS analysis. HepG2 cells were transfected with Bax siRNA or control siRNA. HepG2 cells were treated by 20 μM TK VI for indicated time periods and stained by annexin V and Rhodamine 123. Quantification of the percentage of apoptotic cells and changes in the mitochondrial membrane potential were detected using Flow Cytometry. Asterisks indicated values significantly different from Bax siRNA cells. **P < 0.01. (D) Change of Cyto-c and Smac distribution was detected after 8-h TK VI (20 μM) treatment. Mitochondria were visualized with red fluorescent protein (Mito-red) and Cyto-c or Smac was marked with FITC-conjugated anti-mouse and anti-rabbit IgG, respectively. (E) The cleavage of procaspase-3 and PARP were detected after 16 h of TK VI treatment. Data represented means and SD. from three independent experiments.
Figure 7
Figure 7
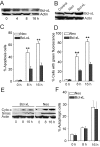
The retardance of apoptosis with overexpression of Bcl-xL. (A) HepG2 cells were treated by 20 μM TK VI and the expression of Bcl-xL was assessed by Immunoblot assay. (B) HepG2 cells were transfected with a pcDNA3.1 vector containing the coding sequence for Bcl-xL (Bcl-xL) or with a neomycin-resistant expression vector pcDNA3.1 (Neo, control) by Lipofectin reagent according to the manufacturer's instructions. Over-expression of Bcl-xL expression was assessed by Western blot. (C) and (D) Apoptotic cells and Dissipation of ΔΨm were quantified by FACS analysis. Results were expressed as means ± SD of triplicate experiments (each performed in duplicate). (E) HepG2 cells were treated by 20 μM TK VI for indicated times. The release of Cyto-c and Smac/DIABLO was assessed in Bcl-xL-overexpression and neo cells by Immunoblot assay. (F) Cells were treated as (C) and then autophagy was analyzed using flow cytometry with acridine orange dyeing. Asterisks indicated values significantly different from Bcl-xL-overexpression cells. **P < 0.01.
Figure 8
Figure 8
Scheme of PCD pathway in HCC cells triggered by TK VI. Ca2+ entered through the cell membrane and activated Bak and calpain. The former ignited autophagy characteristic of cytoplasmic vacuolation and the latter promoted the translocation of Bax, which targeted mitochondria. On the other hand, Bcl-xL was downregulated almost in concurrence with the translocation of Bax. Bcl-xL overexpression retarded apoptosis, whereas it had no effect on authoagy. The release of Cyto-c and Smac from mitochondria into the cytosol was triggered by the preceding events, promoting the acivation of caspase-3 which subsequently led to PARP activation. Specific depletion of Bak expression could partly attenuate TK VI-induced autophagy. However, blockage of Bax led to increased autophagy.

Similar articles

Cited by

References

    1. Schepelmann S, Hallenbeck P, Ogilvie LM, Hedley D, Friedlos F, Martin J, Scanlon I, Hay C, Hawkins LK, Marais R, Springer CJ. Systemic gene-directed enzyme prodrug therapy of hepatocellular carcinoma using a targeted adenovirus armed with carboxypeptidase G2. Cancer Res. 2005;65:5003–8. doi: 10.1158/0008-5472.CAN-05-0393. - DOI - PubMed
    1. Lum CT, Yang ZF, Li HY, Wai-Yin Sun R, Fan ST, Poon RT, Lin MC, Che CM, Kung HF. Gold(III) compound is a novel chemocytotoxic agent for hepatocellular carcinoma. Int J Cancer. 2006;118:1527–38. doi: 10.1002/ijc.21484. - DOI - PubMed
    1. Wang SW, Pan SL, Huang YC, Guh JH, Chiang PC, Huang DY, Kuo SC, Lee KH, Teng CM. CHM-1, a novel synthetic quinolone with potent and selective antimitotic antitumor activity against human hepatocellular carcinoma in vitro and in vivo. Mol Cancer Ther. 2008;7:350–60. doi: 10.1158/1535-7163.MCT-07-2000. - DOI - PubMed
    1. Lee CH, Wu CL, Shiau AL. Salmonella choleraesuis as an anticancer agent in a syngeneic model of orthotopic hepatocellular carcinoma. Int J Cancer. 2008;122:930–5. doi: 10.1002/ijc.23047. - DOI - PubMed
    1. Hermosa MR, Grondona I, Iturriaga EA, Diaz-Minguez JM, Castro C, Monte E, Garcia-Acha I. Molecular characterization and identification of biocontrol isolates of Trichoderma spp. Appl Environ Microbiol. 2002;66:1890–1898. doi: 10.1128/AEM.66.5.1890-1898.2000. - DOI - PMC - PubMed

Publication types

MeSH terms