Comparative Study
. 2010 Feb 2:4:8.
doi: 10.1186/1752-0509-4-8.

A general co-expression network-based approach to gene expression analysis: comparison and applications

Affiliations
Comparative Study

A general co-expression network-based approach to gene expression analysis: comparison and applications

Jianhua Ruan et al. BMC Syst Biol. .

Abstract

Background: Co-expression network-based approaches have become popular in analyzing microarray data, such as for detecting functional gene modules. However, co-expression networks are often constructed by ad hoc methods, and network-based analyses have not been shown to outperform the conventional cluster analyses, partially due to the lack of an unbiased evaluation metric.

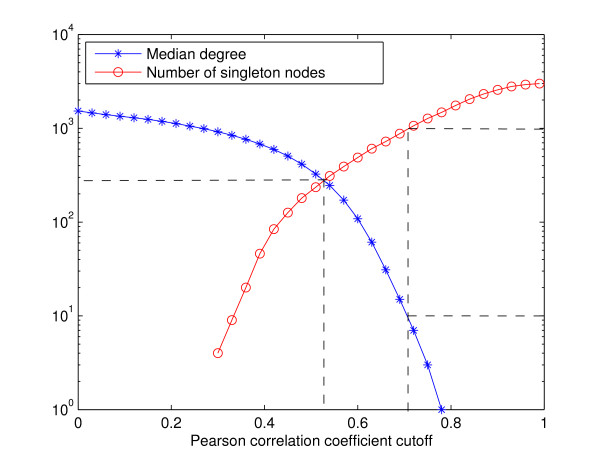
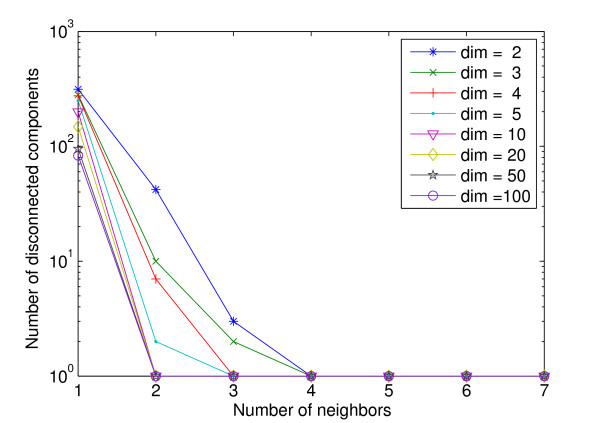
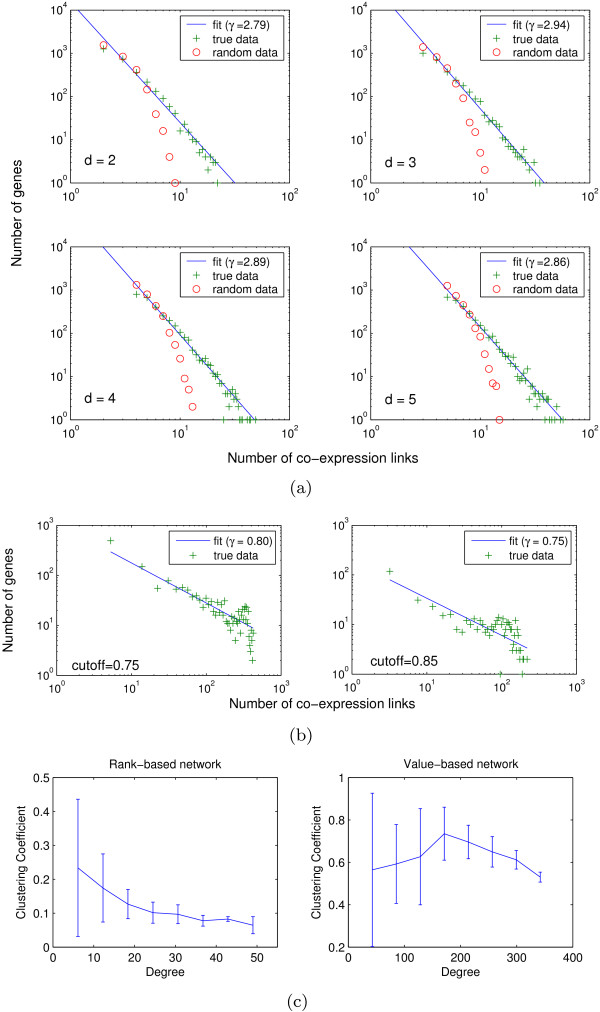
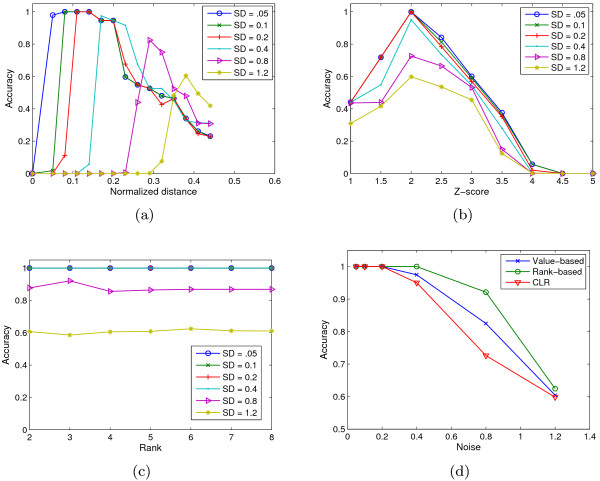
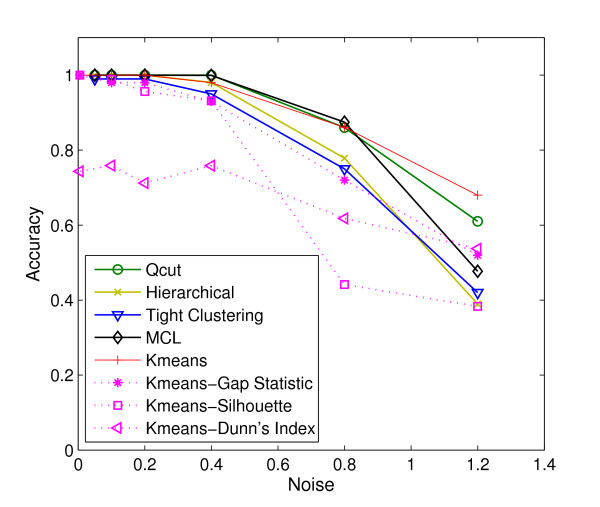
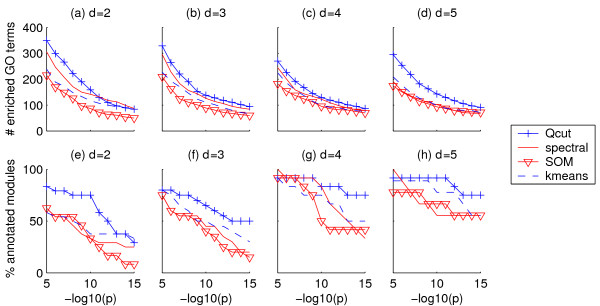
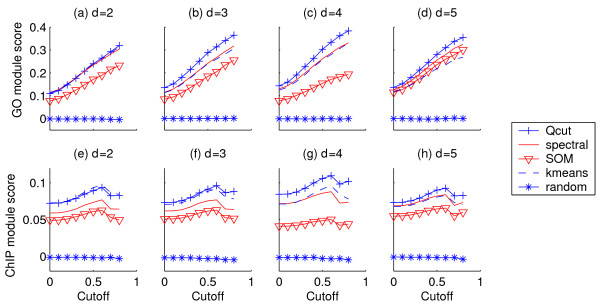
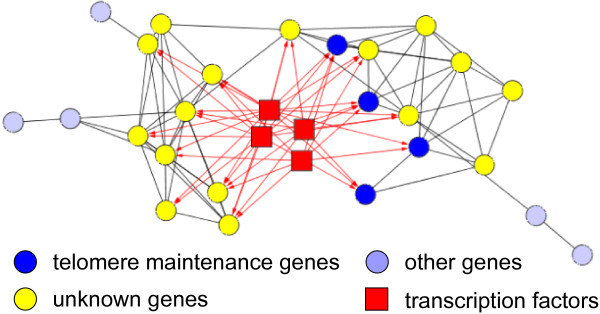
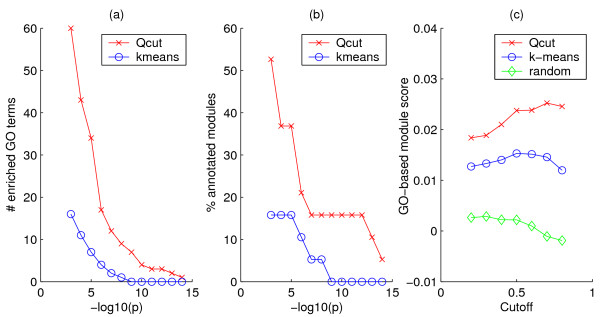
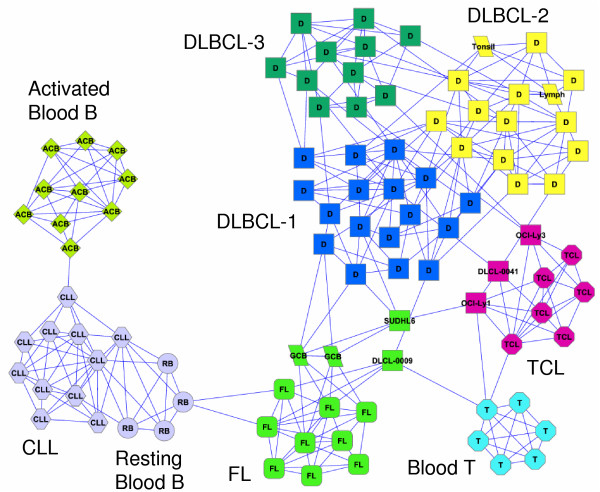
Results: Here, we develop a general co-expression network-based approach for analyzing both genes and samples in microarray data. Our approach consists of a simple but robust rank-based network construction method, a parameter-free module discovery algorithm and a novel reference network-based metric for module evaluation. We report some interesting topological properties of rank-based co-expression networks that are very different from that of value-based networks in the literature. Using a large set of synthetic and real microarray data, we demonstrate the superior performance of our approach over several popular existing algorithms. Applications of our approach to yeast, Arabidopsis and human cancer microarray data reveal many interesting modules, including a fatal subtype of lymphoma and a gene module regulating yeast telomere integrity, which were missed by the existing methods.

Conclusions: We demonstrated that our novel approach is very effective in discovering the modular structures in microarray data, both for genes and for samples. As the method is essentially parameter-free, it may be applied to large data sets where the number of clusters is difficult to estimate. The method is also very general and can be applied to other types of data. A MATLAB implementation of our algorithm can be downloaded from http://cs.utsa.edu/~jruan/Software.html.


Figures

Figure 1
Figure 1
Median degree and number of singleton nodes in a value-based yeast co-expression network. Horizontal axis: the Pearson correlation coefficient threshold for the value-based network construction. Left vertical axis: median number of co-expression links per gene. Right vertical axis: number of genes without a co-expression link.
Figure 2
Figure 2
Connectivity of rank-based co-expression networks on random data. Each data set contains 1000 random geometric points in a certain number of dimensions, generated using the standard Gaussian distribution. Y-axis shows the number of disconnected components in the co-expression network constructed by the rank-based approach.
Figure 3
Figure 3
Topological properties of co-expression networks. (a) Degree distribution of rank-based co-expression networks. (b) Degree distribution of value-based co-expression networks. (c) Relationship between clustering coefficient and degree in rank-based and value-based co-expression networks.
Figure 4
Figure 4
Effects of network construction methods on the clustering accuracy of Qcut. (a) Clustering accuracy on value-based networks, as a function of the distance cutoffs. (b) Clustering accuracy on CLR co-expression networks, as a function of the Z-score cutoffs. (c) Clustering accuracy on rank-based networks, as a function of the rank cutoffs. (d) Best clustering accuracy on the three types of networks, constructed with the optimal cutoffs. In all four plots, each data point is an average over the results of 100 synthetic microarray data sets.
Figure 5
Figure 5
Comparison of different clustering methods using synthetic microarray data. Qcut and MCL are applied to rank-based networks constructed with d = 4. Each data point in the plot is an average over 100 synthetic microarray data sets.
Figure 6
Figure 6
Enrichment of GO terms in yeast co-expression networks. Vertical axes in (a)-(d): number of GO terms enriched in the clusters. Vertical axes in (e)-(h): percentage of clusters that are enriched with at least one GO term. Horizontal axes: p-value cutoff to consider a GO term enriched.
Figure 7
Figure 7
Yeast gene co-expression network module scores based on reference networks. Reference networks are derived from GO annotations (a-d) and ChIP-chip data (e-h). Horizontal axes: edge weight cutoff for the reference networks.
Figure 8
Figure 8
A network of co-expressed and co-regulated genes with functions in telomerase maintenance. Each directed edge pointing from a TF to a gene represents a protein-DNA interaction. All other edges represent co-expression relationships.
Figure 9
Figure 9
Enrichment of GO terms in the Arabidopsis co-expression network. (a) Number of enriched GO terms; (b) Percentage of clusters with at least one enriched GO term; (c) Gene module scores measured by the GO-based reference networks. Horizontal axes in (a) and (b) are p-value cutoffs on GO term enrichment. The horizontal axis in (c) corresponds to the edge weight cutoffs for reference networks.
Figure 10
Figure 10
A co-expression network of cancer cells. Each cluster is shown with a different color. Each cell type is represented by a unique combination of the shape and text inside a node. Square nodes with D inside represent DLBCL cells. DLBCL outliers that were incorrectly classified are shown with their actual names inside square nodes. Abbreviations: TCL - transformed cell line; GCB - germinal centre B; DLBCB - diffuse large B cell lymphoma; CLL - chronic lymphocytic leukemia, FL - follicular lymphoma; ACB - activated blood B; RB - resting blood B.

References

    1. Eisen M, Spellman P, Brown P, Botstein D. Cluster analysis and display of genome-wide expression patterns. Proc Natl Acad Sci USA. 1998;95:14863–8. doi: 10.1073/pnas.95.25.14863. - DOI - PMC - PubMed
    1. Tegner J, Yeung M, Hasty J, Collins J. Reverse engineering gene networks: integrating genetic perturbations with dynamical modeling. Proc Natl Acad Sci USA. 2003;100:5944–9. doi: 10.1073/pnas.0933416100. - DOI - PMC - PubMed
    1. Friedman N, Linial M, Nachman I, Peer D. Using Bayesian networks to analyze expression data. J Comput Biol. 2000;7:601–20. doi: 10.1089/106652700750050961. - DOI - PubMed
    1. Davidich M, Bornholdt S. Boolean network model predicts cell cycle sequence of fission yeast. PLoS ONE. 2008;3:e1672. doi: 10.1371/journal.pone.0001672. - DOI - PMC - PubMed
    1. Presson A, Sobel E, Papp J, Suarez C, Whistler T, Rajeevan M, Vernon S, Horvath S. Integrated weighted gene co-expression network analysis with an application to chronic fatigue syndrome. BMC Syst Biol. 2008;2:95. doi: 10.1186/1752-0509-2-95. - DOI - PMC - PubMed

Publication types

MeSH terms