Ethanol withdrawal acts as an age-specific stressor to activate cerebellar p38 kinase
- PMID: 20122756
- PMCID: PMC7204394
- DOI: 10.1016/j.neurobiolaging.2010.01.005
Ethanol withdrawal acts as an age-specific stressor to activate cerebellar p38 kinase
Abstract
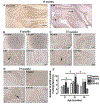
We investigated whether protein kinase p38 plays a role in the brain-aging changes associated with repeated ethanol withdrawal (EW). Ovariectomized young, middle-age and older rats, with or without 17β-estradiol (E2) implantation, received a 90-day ethanol with repeated withdrawal. They were tested for active pP38 expression in cerebellar Purkinje neurons and whole-cerebellar lysates using immunohistochemistry and enzyme-linked immunosorbent assay, respectively. They were also tested for the Rotarod task to determine the behavioral manifestation of cerebellar neuronal stress and for reactive oxygen species (ROS) and mitochondrial protein carbonyls to determine oxidative mechanisms. Middle-age EW rats showed higher levels of pP38-positive Purkinje neurons/cerebellar lysates, which coincided with increased mitochondrial protein oxidation than other diet/age groups. Exacerbated motor deficit due to age-EW combination also began at the middle-age. In comparison, ROS contents peaked in older EW rats. E2 treatment mitigated each of the EW effects to a different extent. Collectively, pP38 may mediate the brain-aging changes associated with pro-oxidant EW at vulnerable ages and in vulnerable neurons in a manner protected by estrogen.
Copyright © 2010 Elsevier Inc. All rights reserved.
Conflict of interest statement
Disclosure Statement
None of authors in this manuscript has any type of conflicts of interest including financial and personal matters.
Figures


Similar articles
-
Intermittent hypoxia conditioning protects mitochondrial cytochrome c oxidase of rat cerebellum from ethanol withdrawal stress.J Appl Physiol (1985). 2012 May;112(10):1706-14. doi: 10.1152/japplphysiol.01428.2011. Epub 2012 Mar 8. J Appl Physiol (1985). 2012. PMID: 22403345 Free PMC article.
-
Role of protein kinase C in estrogen protection against apoptotic cerebellar cell death in ethanol-withdrawn rats.Alcohol. 2003 Aug-Oct;31(1-2):39-48. doi: 10.1016/j.alcohol.2003.07.004. Alcohol. 2003. PMID: 14615010
-
Ethanol withdrawal reduces cerebellar parvalbumin expression in a manner reversed by estrogens.Neurosci Lett. 2005 Mar 22;377(1):44-8. doi: 10.1016/j.neulet.2004.11.067. Epub 2004 Dec 21. Neurosci Lett. 2005. PMID: 15722185
-
Alcohol withdrawal and brain injuries: beyond classical mechanisms.Molecules. 2010 Jul 20;15(7):4984-5011. doi: 10.3390/molecules15074984. Molecules. 2010. PMID: 20657404 Free PMC article. Review.
-
Estrogen neuroprotection against the neurotoxic effects of ethanol withdrawal: potential mechanisms.Exp Biol Med (Maywood). 2005 Jan;230(1):8-22. doi: 10.1177/153537020523000102. Exp Biol Med (Maywood). 2005. PMID: 15618121 Review.
Cited by
-
Lipopolysaccharide exacerbates infarct size and results in worsened post-stroke behavioral outcomes.Behav Brain Funct. 2015 Oct 13;11(1):32. doi: 10.1186/s12993-015-0077-5. Behav Brain Funct. 2015. PMID: 26463864 Free PMC article.
-
Age-related Purkinje cell death is steroid dependent: RORα haplo-insufficiency impairs plasma and cerebellar steroids and Purkinje cell survival.Age (Dordr). 2011 Dec;33(4):565-78. doi: 10.1007/s11357-010-9203-3. Epub 2011 Jan 11. Age (Dordr). 2011. PMID: 21222044 Free PMC article.
-
Intermittent hypoxia training blunts cerebrocortical presenilin 1 overexpression and amyloid-β accumulation in ethanol-withdrawn rats.Am J Physiol Regul Integr Comp Physiol. 2017 Jul 1;313(1):R10-R18. doi: 10.1152/ajpregu.00050.2017. Epub 2017 May 10. Am J Physiol Regul Integr Comp Physiol. 2017. PMID: 28490448 Free PMC article.
-
JNK Signaling Positively Regulates Acute Ethanol Tolerance in C. elegans.Int J Mol Sci. 2024 Jun 10;25(12):6398. doi: 10.3390/ijms25126398. Int J Mol Sci. 2024. PMID: 38928105 Free PMC article.
-
Alcohol Withdrawal and Cerebellar Mitochondria.Cerebellum. 2015 Aug;14(4):421-37. doi: 10.1007/s12311-014-0598-8. Cerebellum. 2015. PMID: 25195804 Review.
References
-
- Arimoto K, Fukuda H, Imajoh-Ohmi S, Saito H, Takekawa M, 2008. Formation of stress granules inhibits apoptosis by suppressing stress-responsive MAPK pathways. Nat. Cell. Biol. 10, 1324–1332. - PubMed
-
- Aydin MV, Sen O, Kayaselcuk F, Bolat F, Tufan K, Caner H, Altinors N, 2005. Analysis and prevalence of inflammatory cells in subtypes of lumbar disc herniations under cyclooxygenase-2 inhibitor therapy. Neurol. Res. 27, 609–612. - PubMed
-
- Barca O, Costoya JA, Senaris RM, Arce VM, 2008. Interferon-beta protects astrocytes against tumour necrosis factor-induced apoptosis via activation of p38 mitogen-activated protein kinase. Exp. Cell. Res. 314, 2231–2237. - PubMed
-
- Campos CB, Bedard PA, Linden R, 2006. Requirement of p38 stress-activated MAP kinase for cell death in the developing retina depends on the stage of cell differentiation. Neurochem. Int. 49, 494–499. - PubMed
Publication types
MeSH terms
Substances
Grants and funding
LinkOut - more resources
Full Text Sources
Medical

