

What is a cohort effect? Comparison of three statistical methods for modeling cohort effects in obesity prevalence in the United States, 1971-2006
- PMID: 20122771
- PMCID: PMC3469580
- DOI: 10.1016/j.socscimed.2009.12.018
What is a cohort effect? Comparison of three statistical methods for modeling cohort effects in obesity prevalence in the United States, 1971-2006
Abstract
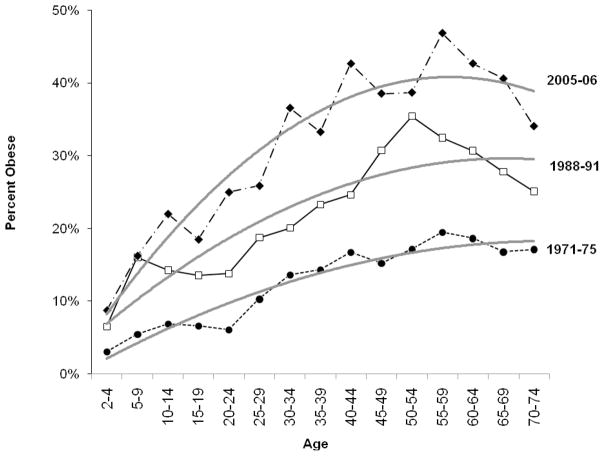
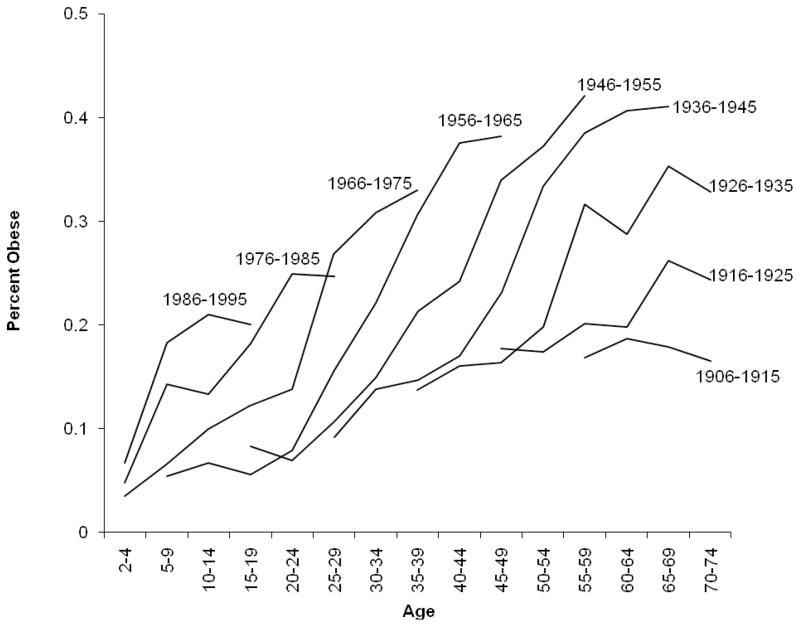
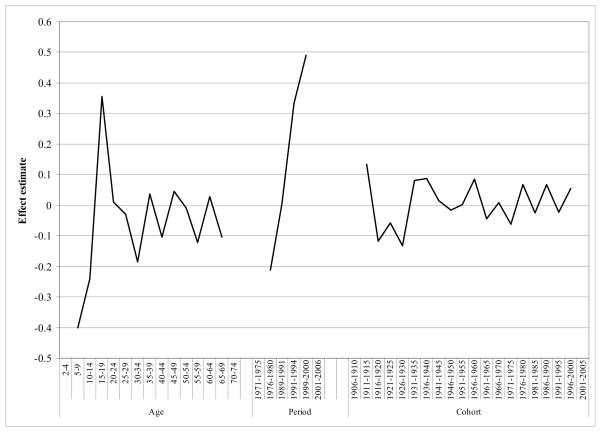
Analysts often use different conceptual definitions of a cohort effect, and therefore different statistical methods, which lead to differing empirical results. A definition often used in sociology assumes that cohorts have unique characteristics confounded by age and period effects, whereas epidemiologists often conceive that period and age effects interact to produce cohort effects. The present study aims to illustrate these differences by estimating age, period, and cohort (APC) effects on obesity prevalence in the U.S. from 1971 to 2006 using both conceptual approaches. Data were drawn from seven cross-sectional waves of the National Health and Nutrition Examination Survey. Obesity was defined as BMI >or=30 for adults and >or=95th percentile for children under the age of 20. APC effects were estimated using the classic constraint-based method (first-order effects estimated and interpreted), the Holford method (first-order effects estimated but second-order effects interpreted), and median polish method (second-order effects are estimated and interpreted). Results indicated that all methods report significant age and period effects, with lower obesity prevalence in early life as well as increasing prevalence in successive surveys. Positive cohort effects for more recently born cohorts emerged based on the constraint-based model; when cohort effects were considered second-order estimates, no significant effects emerged. First-order estimates of age-period-cohort effects are often criticized because of their reliance on arbitrary constraints, but may be conceptually meaningful for sociological research questions. Second-order estimates are statistically estimable and produce conceptually meaningful results for epidemiological research questions. Age-period-cohort analysts should explicitly state the definition of a cohort effect under consideration. Our analyses suggest that the prevalence of obesity in the U.S. in the latter part of the 20th century rose across all birth cohorts, in the manner expected based on estimated age and period effects. As such, the absence or presence of cohort effects depends on the conceptual definition and therefore statistical method used.
(c) 2010 Elsevier Ltd. All rights reserved.
Figures
References
-
- Allman-Farinelli MA, Chey T, Bauman AE, Gill T, James WP. Age, period and birth cohort effects on prevalence of overweight and obesity in Australian adults from 1990 to 2000. Eur J Clin Nutr. 2008;62(7):898–907. - PubMed
-
- Aneshensel CS, Rutter CM, Lachenbruch PA. Social structure, stress, and mental health: competing conceptual and analytic methods. American Sociological Review. 1991;56(2):166–178.
-
- Centers for Disease Control and Prevention. [Accessed May 9th, 2009];National Health and Nutrition Examination Survey. Available at: http://www.cdc.gov/nchs/about/major/nhanes/datalink.htm.
-
- Clayton D, Schifflers E. Models for temporal variation in cancer rates. II: Age-period-cohort models. Stat Med. 1987;6(4):469–481. - PubMed
-
- Cole TJ, Power C, Moore GE. Intergenerational obesity involves both the father and the mother. Am J Clin Nutr. 2008;87(5):1535–1536. author reply 1536–1537. - PubMed
Publication types
MeSH terms
Grants and funding
LinkOut - more resources
Full Text Sources
Medical
Research Materials
