. 2010 Apr;88(2):238-49.
doi: 10.1016/j.yexmp.2010.01.006. Epub 2010 Feb 1.

Specific targeting to B cells by lipid-based nanoparticles conjugated with a novel CD22-ScFv

Affiliations

Specific targeting to B cells by lipid-based nanoparticles conjugated with a novel CD22-ScFv

Kristin Loomis et al. Exp Mol Pathol. 2010 Apr.

Abstract

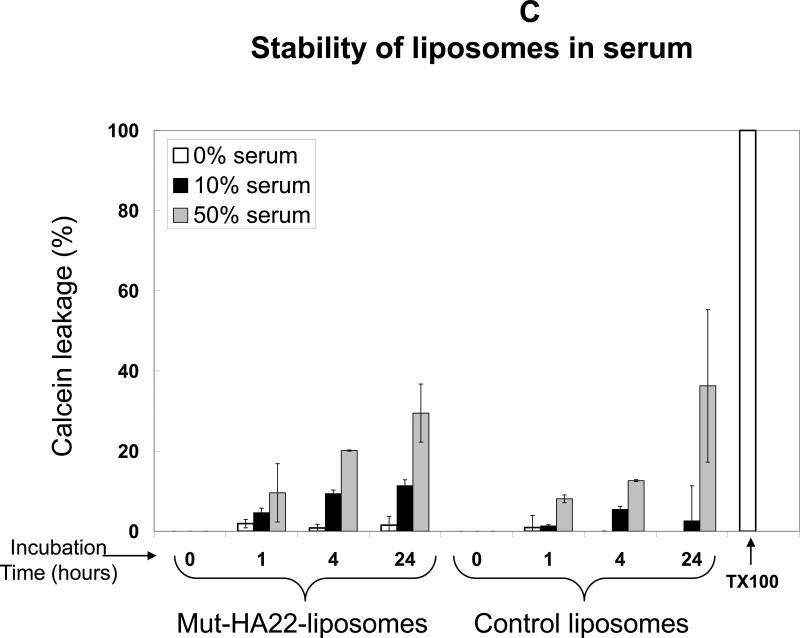
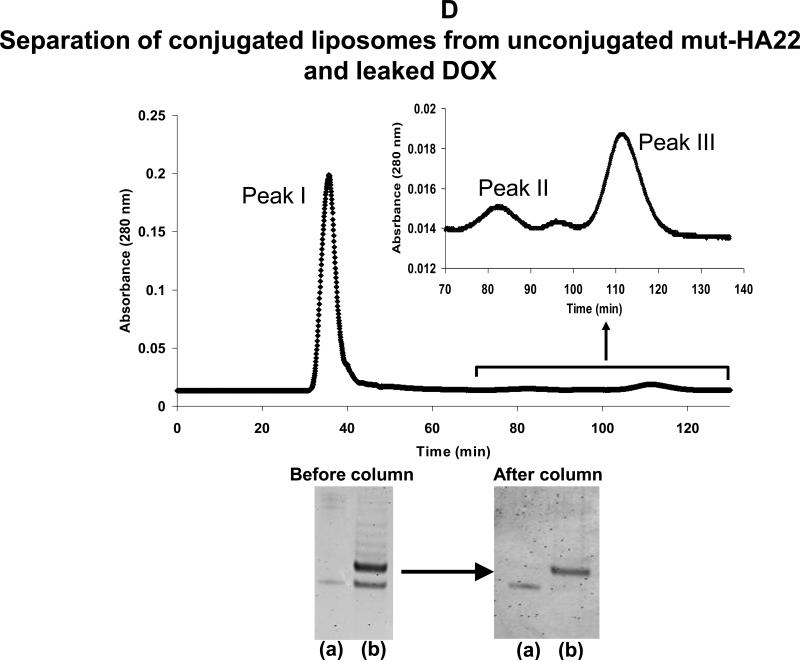
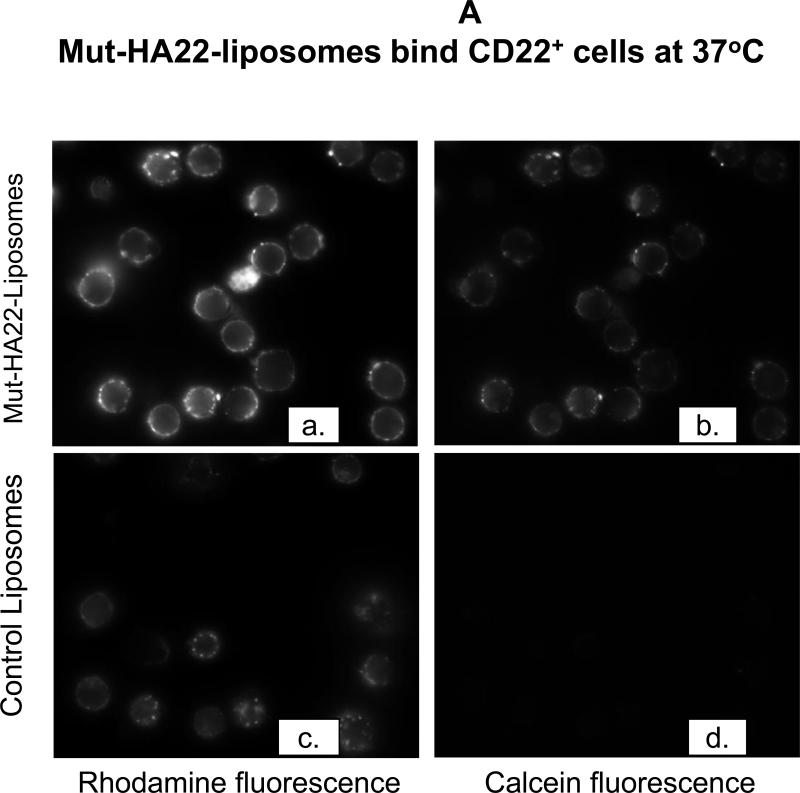
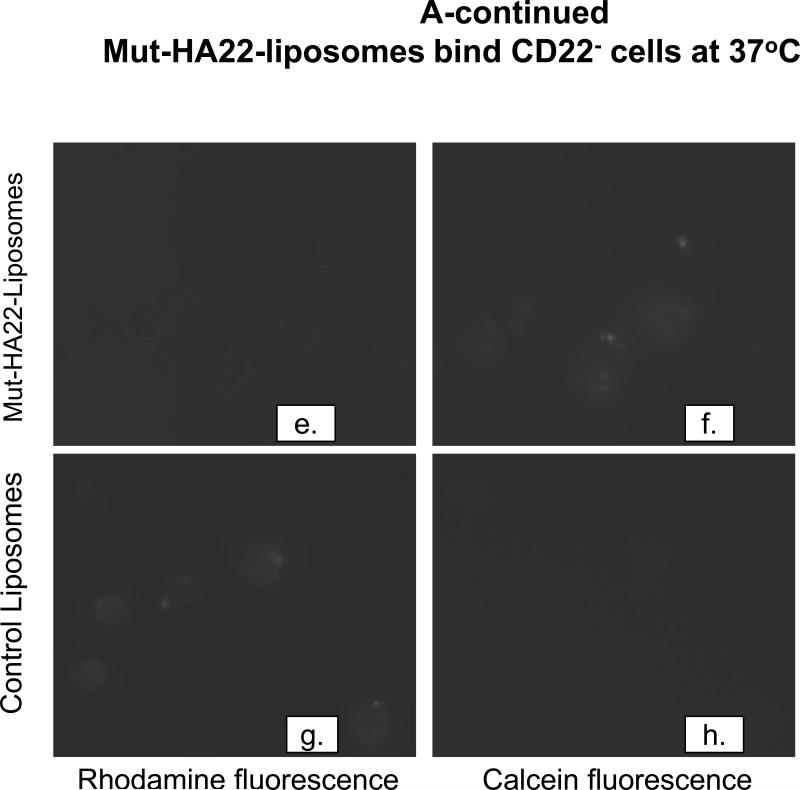
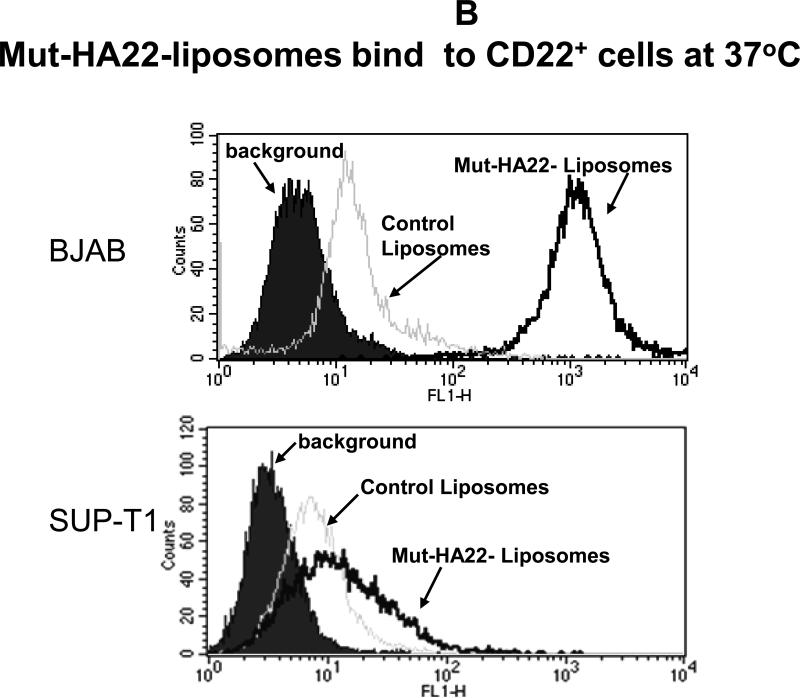
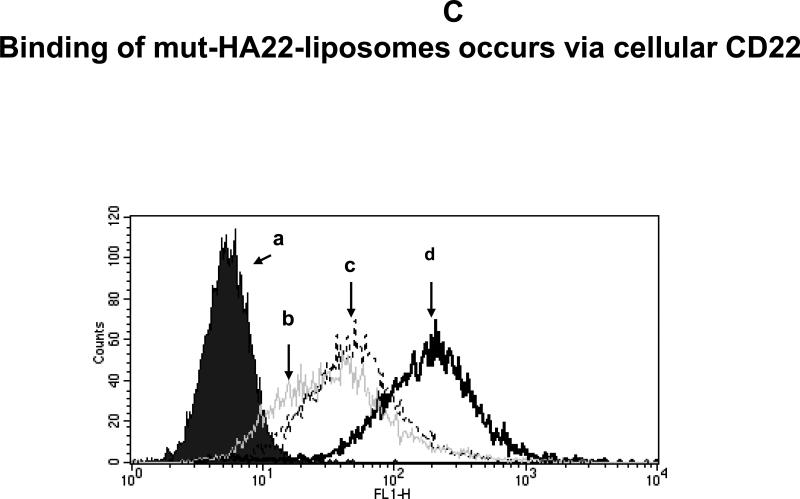
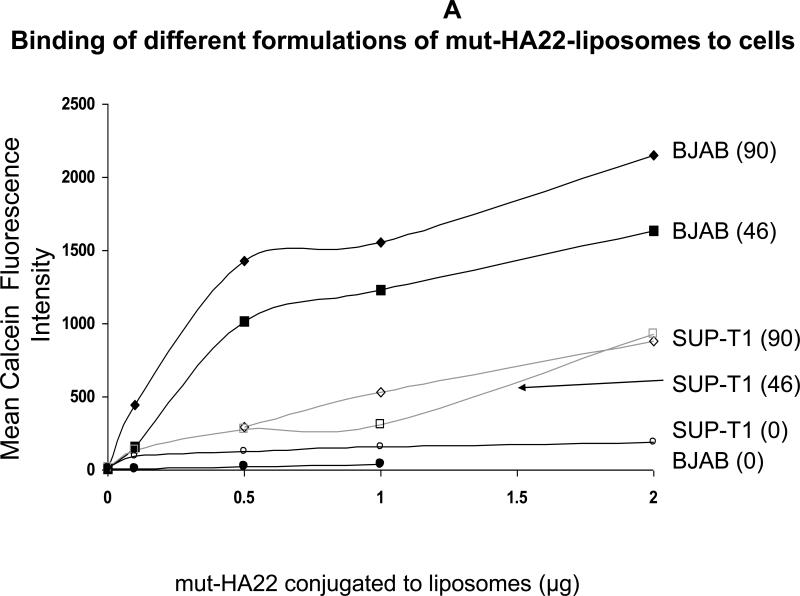
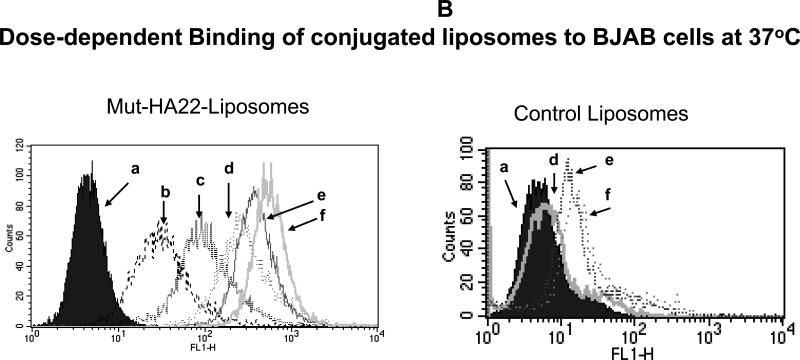
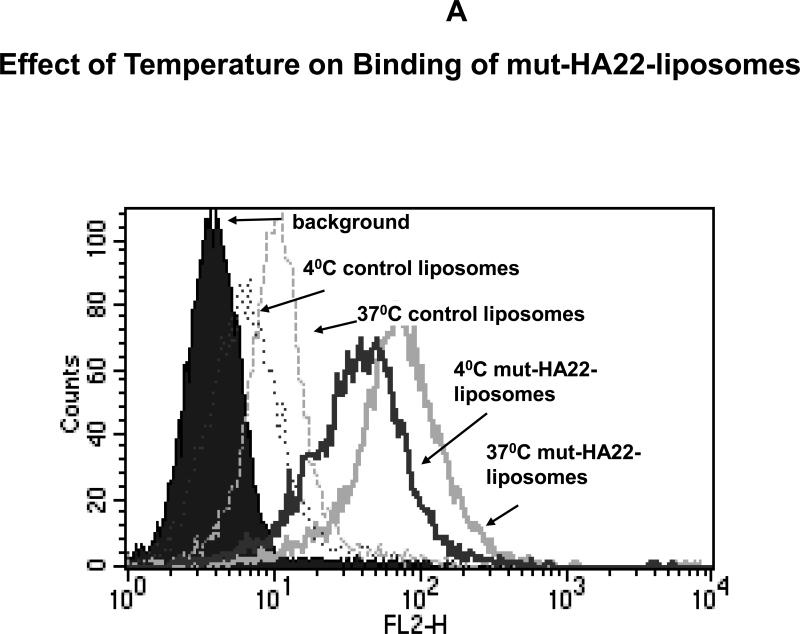
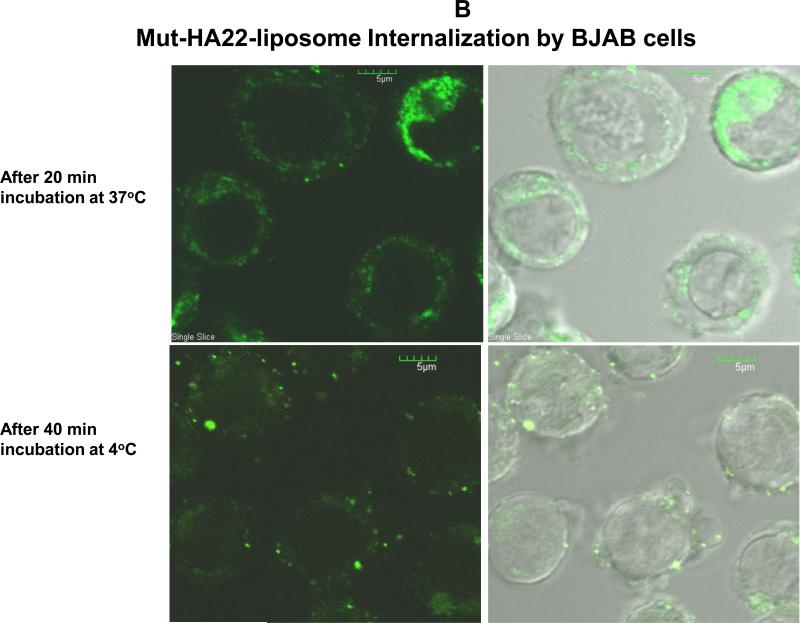
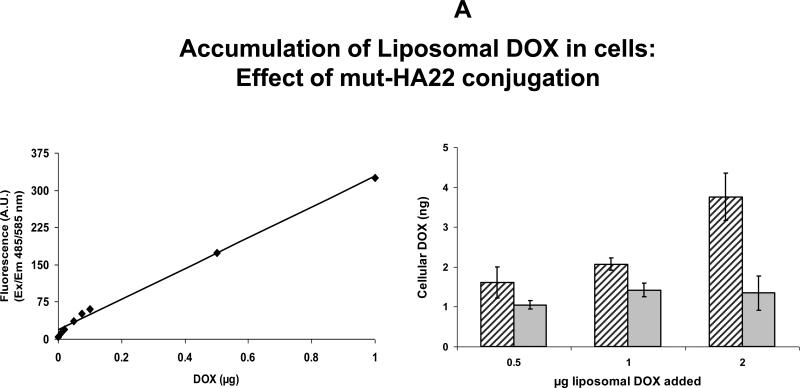
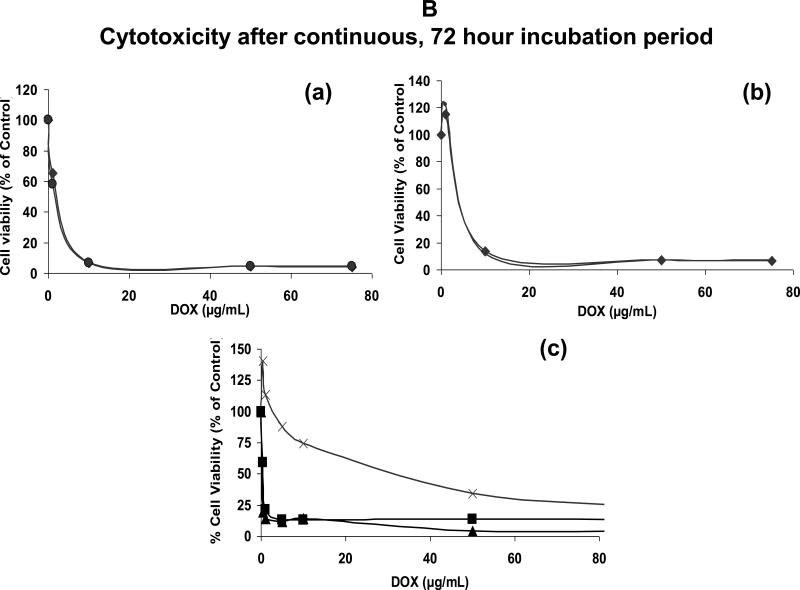
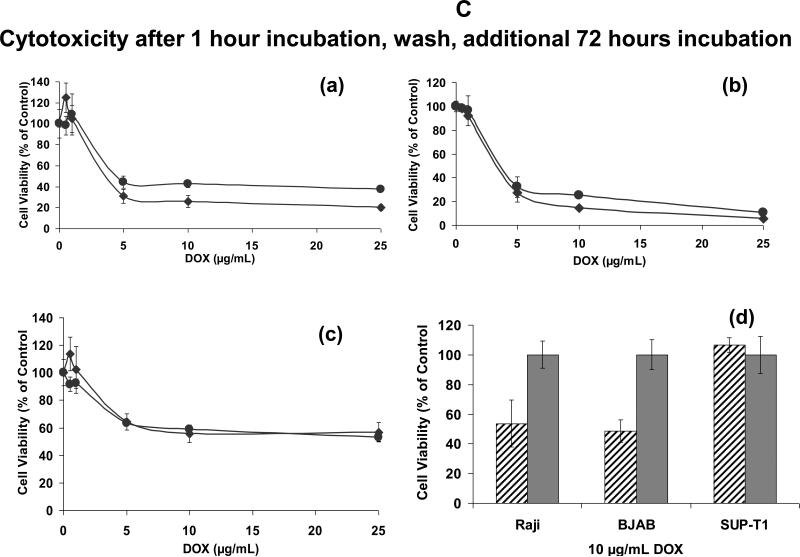
The CD22 antigen is a viable target for therapeutic intervention for B-cell lymphomas. Several therapeutic anti-CD22 antibodies as well as an anti-CD22-based immunotoxin (HA22) are currently under investigation in clinical settings. Coupling of anti-CD22 reagents with a nano-drug delivery vehicle is projected to significantly improve treatment efficacies. Therefore, we generated a mutant of the targeting segment of HA22 (a CD22 scFv) to increase its soluble expression (mut-HA22), and conjugated it to the surface of sonicated liposomes to generate immunoliposomes (mut-HA22-liposomes). We examined liposome binding and uptake by CD22(+) B-lymphocytes (BJAB) by using calcein and/or rhodamine PE-labeled liposomes. We also tested the effect of targeting on cellular toxicity with doxorubicin-loaded liposomes. We report that: (i) Binding of mut-HA22-liposomes to BJAB cells was significantly greater than liposomes not conjugated with mut-HA22 (control liposomes), and mut-HA22-liposomes bind to and are taken in by BJAB cells in a dose and temperature-dependent manner, respectively; (ii) This binding occurred via the interaction with the cellular CD22 as pre-incubation of the cells with mut-HA22 blocked subsequent liposome binding; (iii) Intracellular localization of mut-HA22-liposomes at 37 degrees C but not at 4 degrees C indicated that our targeted liposomes were taken up through an energy dependent process via receptor-mediated endocytosis; and (iv) Mut-HA22-liposomes loaded with doxorubicin exhibited at least 2-3 fold more accumulation of doxorubicin in BJAB cells as compared to control liposomes. Moreover, these liposomes showed at least a 2-4 fold enhanced killing of BJAB or Raji cells (CD22(+)), but not SUP-T1 cells (CD22(-)). Taken together these data suggest that these 2nd-generation liposomes may serve as promising carriers for targeted drug delivery to treat patients suffering from B-cell lymphoma.


Figures

Figure 1
Figure 1. Characterization of mut-HA22
Figure 1A: Analysis of mut-HA22. Mut-HA22 was analyzed by gel electrophoresis. (Left Panel), mutations to the CDR3 region of HA22 increased soluble expression of the scFv. (Right Panel), verification of mut-HA22 reduction by gel electrophoresis: (a) mut-HA22, shown as a monomer and dimer, (b) mut-HA22 reduced with tributylphosphine (TBP), and (c) mut-HA22 reduced with dithiothreitol (DTT). Figure 1B: Mut-HA22 binds to CD22-expressing cells. To analyze specific binding of mut-HA22 with CD22, BJAB cells were incubated with 2μg mut-HA22 followed by sequential incubations with mouse anti-histidine IgG, and FITC-conjugated goat anti-mouse IgG. A commercial anti-CD22 IgG MYG13 was used as positive control, and was stained with FITC-conjugated goat anti-mouse IgG. SUP-T1 and Jurkat cells were used as negative controls. Graphs representing corresponding cell types are indicated. Fluorescence distributions of stained cells are: solid black curves, cells alone; black lines, immunostaining of mut-HA22; grey lines, immunostaining of MYG13; black dotted lines, mut-HA22's secondary Abs (mouse anti-his IgG and FITC conjugated goat anti-mouse IgG; dotted grey lines, MYG13's secondary Abs (FITC-conjugated goat anti-mouse IgG). These results were reproducible from at least three independent experiments. Bkg, background binding.
Figure 2
Figure 2. Characterization of mut-HA22-liposomes
Figure 2A: Determination of mut-HA22 conjugation to liposomes. Concentrated liposomes were prepared in sample buffer with or without DTT, and were loaded on a 4-12% Bis-Tris gel (under non-reducing conditions). The gel was run in MES-SDS running buffer at 200V for 35 minutes and proteins were stained with Microwave Blue. Conjugation of mut-HA22 to DSPE-PEG2000-Maleimide is verified by the molecular weight increase of free mut-HA22 to liposomal mut-HA22 (indicated by the arrow). Figure 2B: Hydrodynamic size distribution of liposomes before and after conjugation with mut-HA22. Hydrodynamic size was measured by backlight scattering in phosphate buffered saline with a Malvern Zetasizer Nano ZS instrument. The data are plotted as volume (top panel) and intensity (bottom panel) weighted distributions. Figure 2C: Stability of mut-HA22-liposomes in the presence of serum at 37°C. Calcein release from liposomes was measured after liposome incubation at 37°C in PBS with 0, 10, or 50% FBS for 0, 1, 4, or 24 hours before and after addition of Triton X-100 (TX100). Leakage is expressed as a percent of total, where 100% calcein leakage was obtained by addition of 20 μl Triton-X100 (10 % w/v) and 0% calcein leakage was the background fluorescence value before liposome incubation at 37°C. Error bars represent ± SD from at least three samples within a single experiment. Figure 2D: Elution profile of DOX-loaded, mut-HA22 liposomes on Sepharose CL-6B column Top panel: mut-HA22 conjugated liposomes were separated from free, unconjugated mut-HA22 scFv through size exclusion chromatography on a Sepharose CL-6B column (1x40cm). 1 mL fractions were collected at an elution rate of 0.37 mL/min. Absorbance at 280nm (as measured by UV detector) is shown. Peak I: DOX-loaded, mut-HA22 conjugated liposomes; Peak II: unconjugated mut-HA22 scFv; Peak III: Free DOX. Bottom panel: Samples in peak I were analyzed (see Fig 2A) to confirm mut-HA22 conjugation to liposomes. (a): mut-HA22 scFv standard; (b): DOX-loaded, mut-HA22 conjugated liposomes before and after Sepharose CL-6B column. The fractions in peak II were analyzed for the presence of mut-HA22 by gel electrophoresis as described (see Methods section, data not shown). Similarly, all fractions were also analyzed for DOX and peak III was assigned accordingly (data not shown).
Figure 3
Figure 3. Binding of mut-HA22-liposomes to CD22-expressing cells
Cells (107/mL in RPMI-1640, 10% serum) were incubated with fluorescently labeled mut-HA22-liposomes (2 μg of mut-HA22/46μg of phospholipids) or control liposomes (0 μg of mut-HA22/46 μg of phospholipids) for 40 minutes at 37°C. At the end of incubations, cells were centrifuged and washed twice with PBS-BSA to remove unbound liposomes; cell-bound fluorescence was examined by microscopy and FACS. Figure 3A: Binding of mut-HA22-liposomes to CD22-receptor expressing cells. Fluorescence images were captured using the Nikon Eclipse TE200 inverted microscope with a 40X oil objective (N.A. 1.30). Images shown are for calcein and rhodamine fluorescence as indicated ((a-d), BJAB cells, (e-h) SUP-T1 cells). Figure 3B: Flow cytometry analysis of incubated cells. The data shown are for calcein fluorescence. Figure 3C: Pre-incubation of cells with free mut-HA22 inhibits subsequent binding of liposomes. BJAB cells were incubated with (b) 8, (c) 2, or (d) 0 μg of free mut-HA22 at 4°C for 30 minutes in the dark, washed twice with cold PBS-BSA, and then incubated with fluorescently labeled mut-HA22-liposomes (1μg/106 cells) at 4°C for 30 minutes ((a) cells only)).
Figure 4
Figure 4
A: Binding of mut-HA22--liposomes with 1% or 4% DSPE-PEG2000-Maleimide to CD22- expressing cells. Cells (107/mL in RPMI-1640, 10% serum) were incubated with various concentrations of calcein-loaded mut-HA22-liposomes for 40 minutes at 37°C. At the end of incubations, cells were centrifuged and washed twice with PBS-BSA to remove unbound liposomes; cell-bound fluorescence was examined by FACS. The graph represents mean fluorescence intensity values (y-axis). Three liposome preparations (see Table 1) corresponding to either 0 mol% (=0 mut-HA22/liposome), 1 mol% (=47 mut-HA22/liposome) or 4 mol% (=90 mut-HA22/liposome) were used for incubations with either BJAB or SUP-T1 cells. The amounts of liposomal mut-HA22 added are given in x-axis. Cell types are indicated at the end of each curve. The numbers in parentheses indicate the average number of mut-HA22/liposome. Figure 4B: Dose-dependent binding of mut-HA22-liposomes to BJAB cells. BJAB cells were incubated with various concentrations of calcein-loaded liposomes for 40 minutes at 37°C. At the end of incubations, cells were washed and analyzed for calcein fluorescence by FACS. Concentrations of liposome-conjugated mut-HA22 added to cells: (a) cells alone, (b) 0.01 μg mut-HA22, (c) 0.05 μg mut-HA22 (d), 0.2 μg mut-HA22, (e) 0.5 μg mut-HA22, and (f) 2 μg mut-HA22. Control liposomes contained the corresponding phospholipid quantities without any mut-HA22.
Figure 4
Figure 4
A: Binding of mut-HA22--liposomes with 1% or 4% DSPE-PEG2000-Maleimide to CD22- expressing cells. Cells (107/mL in RPMI-1640, 10% serum) were incubated with various concentrations of calcein-loaded mut-HA22-liposomes for 40 minutes at 37°C. At the end of incubations, cells were centrifuged and washed twice with PBS-BSA to remove unbound liposomes; cell-bound fluorescence was examined by FACS. The graph represents mean fluorescence intensity values (y-axis). Three liposome preparations (see Table 1) corresponding to either 0 mol% (=0 mut-HA22/liposome), 1 mol% (=47 mut-HA22/liposome) or 4 mol% (=90 mut-HA22/liposome) were used for incubations with either BJAB or SUP-T1 cells. The amounts of liposomal mut-HA22 added are given in x-axis. Cell types are indicated at the end of each curve. The numbers in parentheses indicate the average number of mut-HA22/liposome. Figure 4B: Dose-dependent binding of mut-HA22-liposomes to BJAB cells. BJAB cells were incubated with various concentrations of calcein-loaded liposomes for 40 minutes at 37°C. At the end of incubations, cells were washed and analyzed for calcein fluorescence by FACS. Concentrations of liposome-conjugated mut-HA22 added to cells: (a) cells alone, (b) 0.01 μg mut-HA22, (c) 0.05 μg mut-HA22 (d), 0.2 μg mut-HA22, (e) 0.5 μg mut-HA22, and (f) 2 μg mut-HA22. Control liposomes contained the corresponding phospholipid quantities without any mut-HA22.
Figure 5
Figure 5. Uptake of mut-HA22-liposomes by BJAB cells at 37°C
BJAB cells (107/mL RPMI-1640) were incubated with liposomes at 37°C or 4°C. Cells were then washed twice with cold PBS-BSA and kept on ice until analyzed. Figure 5A: Temperature Dependent Binding/Uptake of mut-HA22-liposomes by BJAB cells. Cells were incubated with 4 μg of liposome-conjugated mut-HA22 (or equivalent amount of phospholipids for control liposomes) for 40 minutes at 37°C or 4°C (see methods section). Cells were then washed and rhodamine fluorescence of cells was analyzed by FACS. Figure 5B: Intracellular Localization of mut-HA22-scFv liposomes by BJAB Cells. Cells were incubated with 0.2 μg of liposome-conjugated mut-HA22 (or equivalent amount of phospholipids for control liposomes) for 20 or 40 minutes at 37 or 4°C. Z-stacks of 14-16 optical slices at 1.7 micron intervals were acquired. Calcein fluorescence of cells is shown in a single slice of the acquired images.
Figure 6
Figure 6
A: Cellular accumulation of liposomal DOX by Raji cells Cells (3×10⁵ cells per sample) were incubated with 0.5 – 2 ug of liposomal DOX for one hour at 37°C. The cells were then washed with phenol-red free culture medium (0.5mL×3) and resuspended in 0.3 mL of PBS and transferred to a 96-well plate (0.1mL×3). Cellular accumulation of DOX was determined using a standard curve of known DOX concentrations in the presence of cell lysates without incubation with liposomes (left panel). Right panel: accumulation of DOX in nanograms. Solid gray bars, control liposomes; black diagonal line bars, mut-HA22 liposomes. Error bars represent ± SD of triplicate samples within a single experiment. Figure 6B: Cell viability in the continuous presence of liposomal DOX Cells were plated in duplicates in a 96-well plate (105/0.1mL per well) and incubated with 0-7.5 ug of liposomal or free DOX for 72 hours at 37°C. Cell viability was calculated taking control sample (without DOX) as 100%. Values represent an average of duplicate samples. (a) and (b) Cytotoxicity by liposomal DOX: (a) BJAB (CD22+), (b) SUP-T1 (CD22-) mut-HA22 liposomes (◆) and control liposomes (●). (c) Cytotoxicity by free DOX: SUP-T1 (X), BJAB (▲), and Raji (■). Figure 6C: Cell viability following pre-incubation with liposomes Cells were incubated in triplicates with liposomal DOX for 1 hour, and any unbound liposomes were washed off. Following an additional 72-hour incubation, cell viability was determined (see Figure 6B). (a) Raji (CD22+), (b) BJAB (CD22+), and (c) SUP-T1 (CD22-) mut-HA22 liposomes (◆) and control liposomes (●) (d) A snapshot of cell viability at a concentration of 10 ug/mL liposomal DOX is shown (Data from the respective curves in Figure 6C (a-c)). In this graph, the total number of cells remaining viable in the presence of control liposomes were taken as 100%. mut-HA22 liposomes (diagonal line bars), control liposomes (gray bars)
Figure 6
Figure 6
A: Cellular accumulation of liposomal DOX by Raji cells Cells (3×10⁵ cells per sample) were incubated with 0.5 – 2 ug of liposomal DOX for one hour at 37°C. The cells were then washed with phenol-red free culture medium (0.5mL×3) and resuspended in 0.3 mL of PBS and transferred to a 96-well plate (0.1mL×3). Cellular accumulation of DOX was determined using a standard curve of known DOX concentrations in the presence of cell lysates without incubation with liposomes (left panel). Right panel: accumulation of DOX in nanograms. Solid gray bars, control liposomes; black diagonal line bars, mut-HA22 liposomes. Error bars represent ± SD of triplicate samples within a single experiment. Figure 6B: Cell viability in the continuous presence of liposomal DOX Cells were plated in duplicates in a 96-well plate (105/0.1mL per well) and incubated with 0-7.5 ug of liposomal or free DOX for 72 hours at 37°C. Cell viability was calculated taking control sample (without DOX) as 100%. Values represent an average of duplicate samples. (a) and (b) Cytotoxicity by liposomal DOX: (a) BJAB (CD22+), (b) SUP-T1 (CD22-) mut-HA22 liposomes (◆) and control liposomes (●). (c) Cytotoxicity by free DOX: SUP-T1 (X), BJAB (▲), and Raji (■). Figure 6C: Cell viability following pre-incubation with liposomes Cells were incubated in triplicates with liposomal DOX for 1 hour, and any unbound liposomes were washed off. Following an additional 72-hour incubation, cell viability was determined (see Figure 6B). (a) Raji (CD22+), (b) BJAB (CD22+), and (c) SUP-T1 (CD22-) mut-HA22 liposomes (◆) and control liposomes (●) (d) A snapshot of cell viability at a concentration of 10 ug/mL liposomal DOX is shown (Data from the respective curves in Figure 6C (a-c)). In this graph, the total number of cells remaining viable in the presence of control liposomes were taken as 100%. mut-HA22 liposomes (diagonal line bars), control liposomes (gray bars)

Similar articles

Cited by

References

    1. Tedder TF, Tuscano J, Sato S, Kehrl JH. CD22, a B lymphocyte-specific adhesion molecule that regulates antigen receptor signaling. Annu Rev Immunol. 1997;15:481–504. - PubMed
    1. Shan D, Press OW. Constitutive endocytosis and degradation of CD22 by human B cells. J Immunol. 1995;154:4466–75. - PubMed
    1. Sato S, Tuscano JM, Inaoki M, Tedder TF. CD22 negatively and positively regulates signal transduction through the B lymphocyte antigen receptor. Semin Immunol. 1998;10:287–97. - PubMed
    1. Dorken B, Moldenhauer G, Pezzutto A, et al. HD39 (B3), a B lineage-restricted antigen whose cell surface expression is limited to resting and activated human B lymphocytes. J Immunol. 1986;136:4470–9. - PubMed
    1. Schwarting R, Stein H, Wang CY. The monoclonal antibodies alpha S-HCL 1 (alpha Leu-14) and alpha S-HCL 3 (alpha Leu-M5) allow the diagnosis of hairy cell leukemia. Blood. 1985;65:974–83. - PubMed

Publication types

MeSH terms

LinkOut - more resources