

Evolution of shear stress, protein expression, and vessel area in an animal model of arterial dilatation in hemodialysis grafts
- PMID: 20123196
- PMCID: PMC2875681
- DOI: 10.1016/j.jvir.2009.09.024
Evolution of shear stress, protein expression, and vessel area in an animal model of arterial dilatation in hemodialysis grafts
Abstract
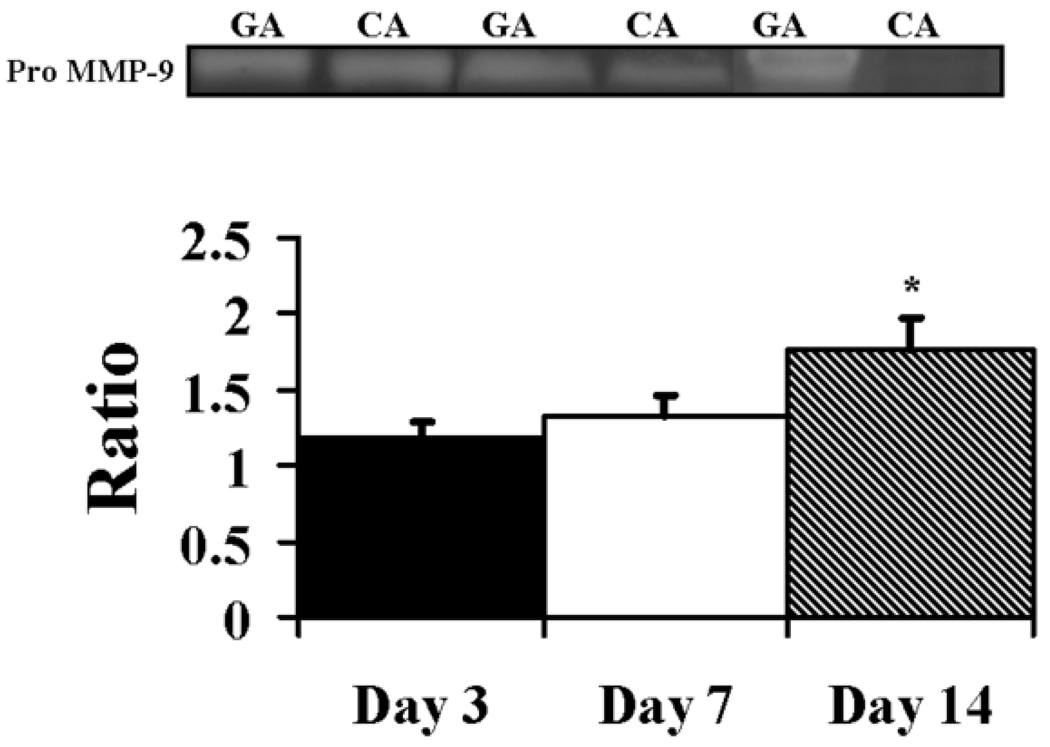
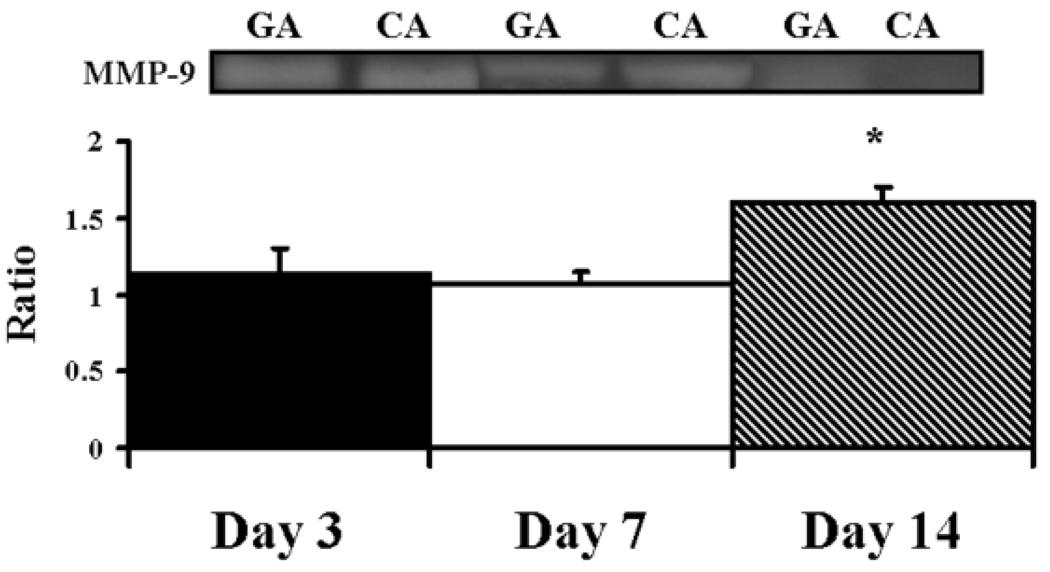
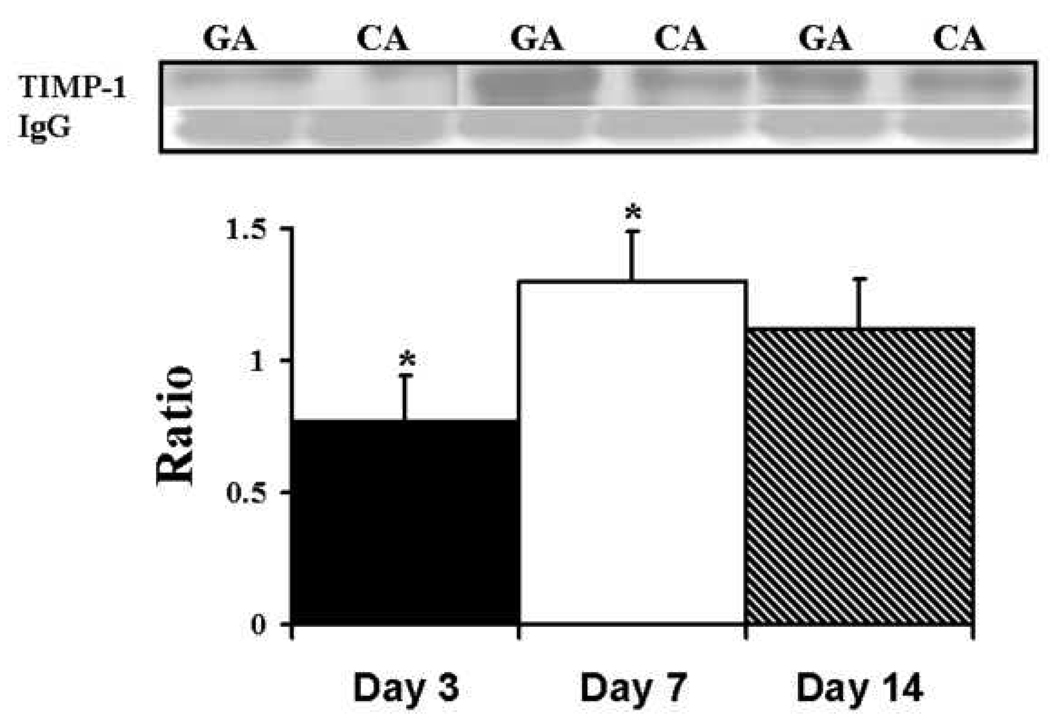
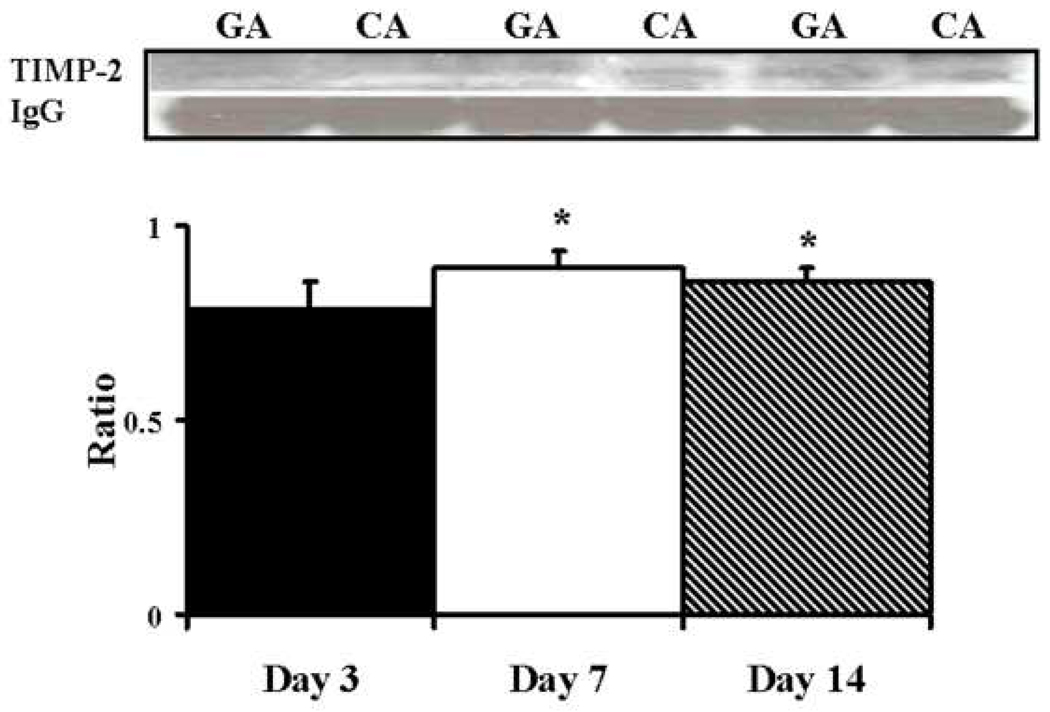
Purpose: To evaluate the wall shear stress, protein expression of matrix metalloproteinase (MMP)-2 and MMP-9 and tissue inhibitor of matrix metalloproteinase (TIMP)-1 and TIMP-2, and vessel area over time in a porcine model for polytetrafluoroethylene (PTFE) hemodialysis grafts.
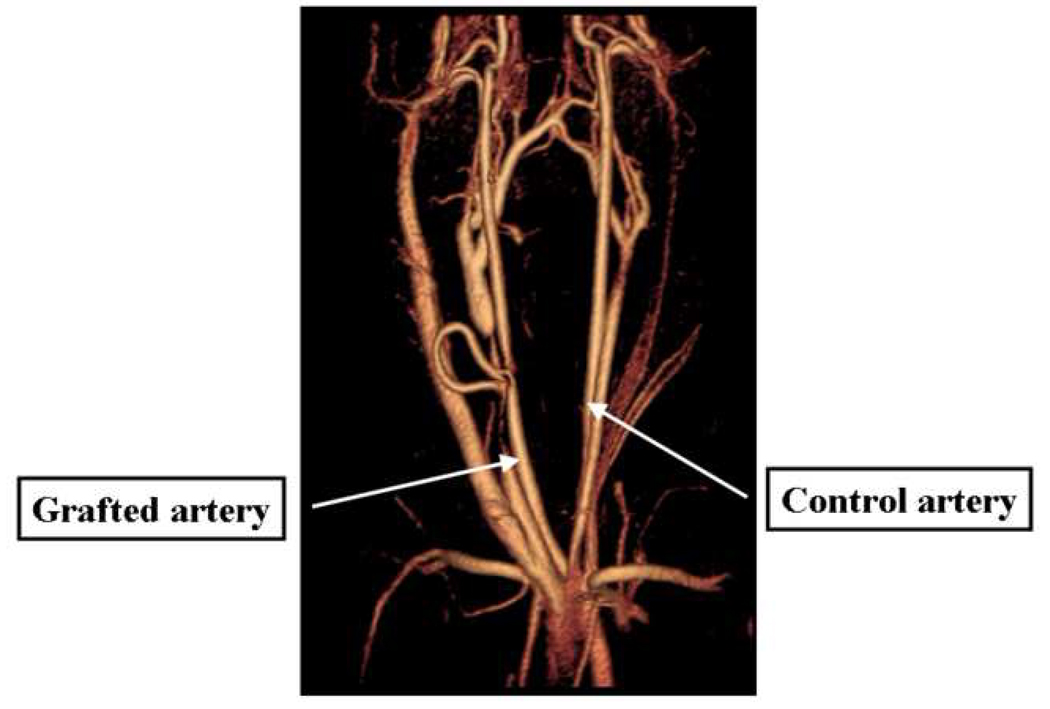
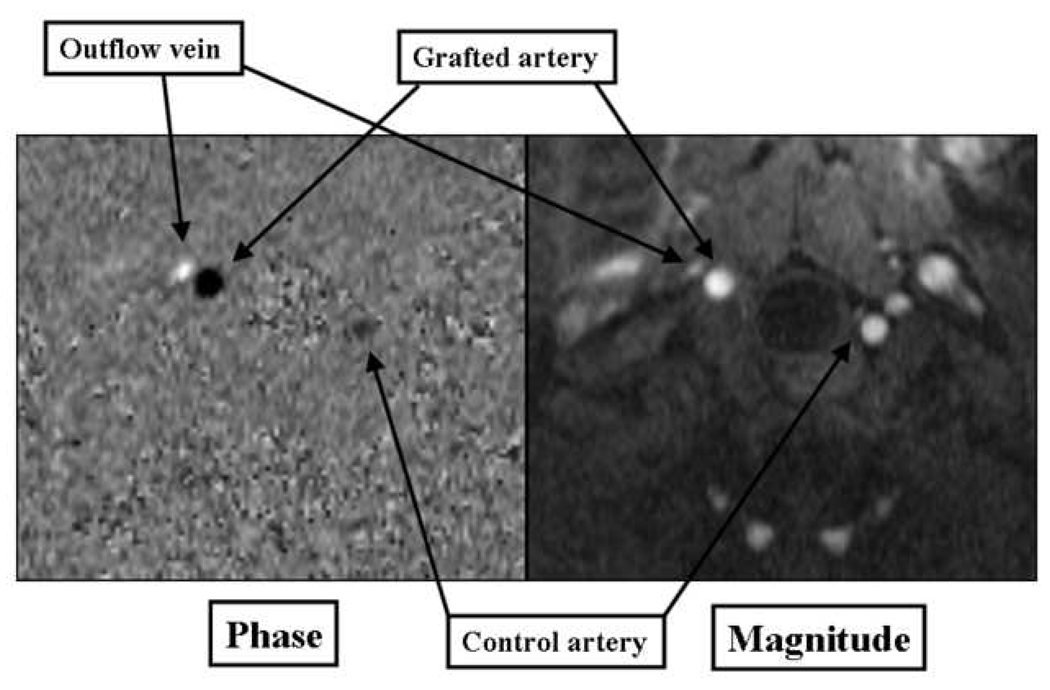
Materials and methods: In 21 pigs, subtotal renal infarction was created, and 28 days later, a PTFE graft was placed to connect the carotid artery to the ipsilateral jugular vein. Phase-contrast magnetic resonance imaging was used to measure blood flow and vessel area at 1, 3, 7, and 14 days after graft placement. Wall shear stress was estimated from the law of Poiseuille. Animals were killed at day 3 (n = 7), day 7 (n = 7), and day 14 (n = 7) and expression of MMP-2, MMP-9, TIMP-1, and TIMP-2 were determined at the grafted and control arteries.
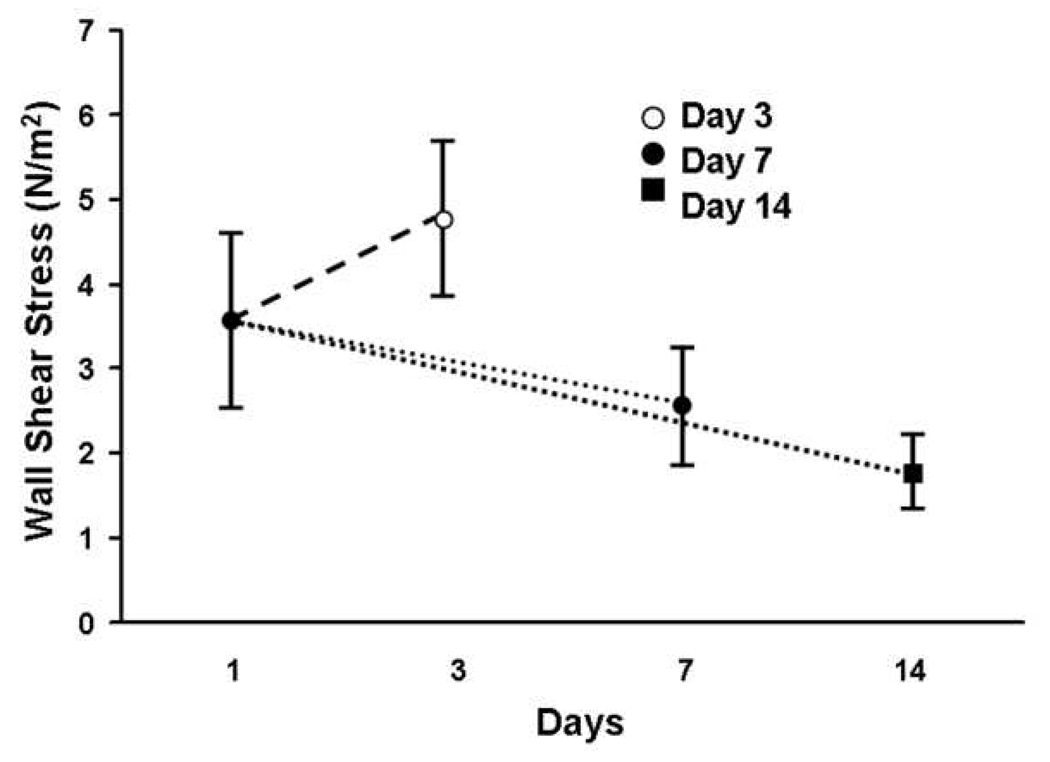
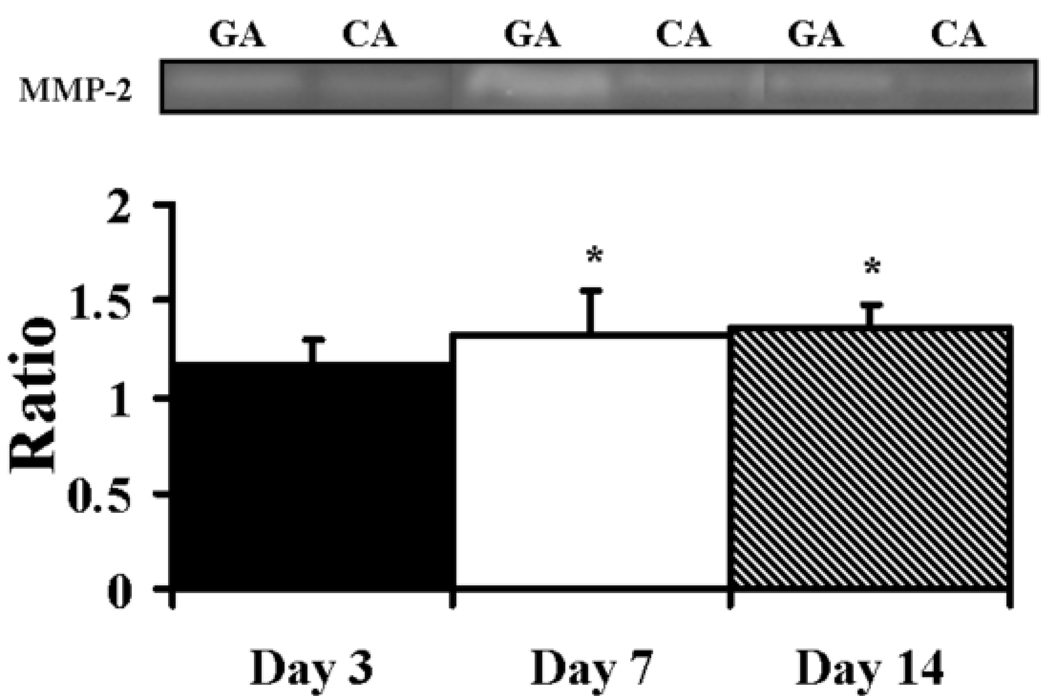
Results: The mean wall shear stress of the grafted artery was higher than in the control artery at all time points (P < .05). It peaked by day 3 and decreased by days 7-14 as the vessel area nearly doubled. By days 7-14, there was a significant increase in active MMP-2 followed by a significant increase in pro-MMP-9 and active MMP-9 by day 14 (P < .05, grafted artery vs control). TIMP-1 expression peaked by day 7 and then decreased, whereas TIMP-2 expression was decreased at days 7-14.
Conclusions: The wall shear stress of the grafted artery peaks by day 3, with increased MMP-2 activity by days 7-14, followed by increase pro-MMP-9 and active MMP-9 by day 14. In addition, the vessel area nearly doubled.
Figures
Similar articles
-
Increased shear stress with upregulation of VEGF-A and its receptors and MMP-2, MMP-9, and TIMP-1 in venous stenosis of hemodialysis grafts.Am J Physiol Heart Circ Physiol. 2008 May;294(5):H2219-30. doi: 10.1152/ajpheart.00650.2007. Epub 2008 Mar 7. Am J Physiol Heart Circ Physiol. 2008. PMID: 18326810 Free PMC article.
-
Pressure distention compared with pharmacologic relaxation in vein grafting upregulates matrix metalloproteinase-2 and -9.J Vasc Surg. 2005 Oct;42(4):747-56. doi: 10.1016/j.jvs.2005.05.037. J Vasc Surg. 2005. PMID: 16242564
-
Adventitial transplantation of blood outgrowth endothelial cells in porcine haemodialysis grafts alleviates hypoxia and decreases neointimal proliferation through a matrix metalloproteinase-9-mediated pathway--a pilot study.Nephrol Dial Transplant. 2009 Jan;24(1):85-96. doi: 10.1093/ndt/gfn433. Epub 2008 Sep 11. Nephrol Dial Transplant. 2009. PMID: 18786975 Free PMC article.
-
Expression of hypoxia inducible factor-1 alpha, macrophage migration inhibition factor, matrix metalloproteinase-2 and -9, and their inhibitors in hemodialysis grafts and arteriovenous fistulas.J Vasc Interv Radiol. 2008 Feb;19(2 Pt 1):252-9. doi: 10.1016/j.jvir.2007.10.031. J Vasc Interv Radiol. 2008. PMID: 18341958
-
Differential expression and activity of matrix metalloproteinases during flow-modulated vein graft remodeling.J Vasc Surg. 2004 May;39(5):1084-90. doi: 10.1016/j.jvs.2003.12.031. J Vasc Surg. 2004. PMID: 15111865
Cited by
-
Bindarit encapsulated nanoparticles prevent venous neointimal hyperplasia and restenosis in a murine angioplasty model.Transl Res. 2022 Oct;248:68-86. doi: 10.1016/j.trsl.2022.06.002. Epub 2022 Jul 29. Transl Res. 2022. PMID: 35914678 Free PMC article.
-
Vein graft failure.J Vasc Surg. 2015 Jan;61(1):203-16. doi: 10.1016/j.jvs.2013.08.019. Epub 2013 Oct 3. J Vasc Surg. 2015. PMID: 24095042 Free PMC article. Review.
-
Reduced patency in left-sided arteriovenous grafts in a porcine model.J Vasc Surg. 2020 Jul;72(1):305-317.e6. doi: 10.1016/j.jvs.2019.06.221. Epub 2019 Nov 4. J Vasc Surg. 2020. PMID: 31699515 Free PMC article.
-
Atorvastatin Reduces In Vivo Fibrin Deposition and Macrophage Accumulation, and Improves Primary Patency Duration and Maturation of Murine Arteriovenous Fistula.J Am Soc Nephrol. 2020 May;31(5):931-945. doi: 10.1681/ASN.2019060612. Epub 2020 Mar 9. J Am Soc Nephrol. 2020. PMID: 32152232 Free PMC article.
-
Comparison of Ophthalmic Artery Morphological Characteristics and Retinal Vessel Diameter for Identifying Ocular Ischemic Syndrome.Invest Ophthalmol Vis Sci. 2023 Sep 1;64(12):20. doi: 10.1167/iovs.64.12.20. Invest Ophthalmol Vis Sci. 2023. PMID: 37695602 Free PMC article.
References
-
- Kamiya A, Togawa T. Adaptive regulation of wall shear stress to flow change in the canine carotid artery. Am J Physiol. 1980;239:H14–H21. - PubMed
-
- Langille BL, Bendeck MP, Keeley FW. Adaptations of carotid arteries of young and mature rabbits to reduced carotid blood flow. Am J Physiol. 1989;256:H931–H939. - PubMed
-
- Collins AJ, Kasiske B, Herzog C, et al. Excerpts from the United States Renal Data System 2003 annual data report: atlas of end-stage renal disease in the United States. Am J Kidney Dis. 2003;42:A5–A7. - PubMed
-
- Murphy GJ, White SA, Nicholson ML. Vascular access for haemodialysis. Br J Surg. 2000;87:1300–1315. - PubMed
-
- Karabay O, Yetkin U, Silistreli E, Uskent H, Onol H, Acikel U. Surgical management of giant aneurysms complicating arteriovenous fistulae. J Int Med Res. 2004;32:214–217. - PubMed
MeSH terms
Substances
Grants and funding
LinkOut - more resources
Full Text Sources
Medical
Research Materials
Miscellaneous
