. 2010 Jun;38(10):3172-85.
doi: 10.1093/nar/gkq023. Epub 2010 Jan 31.

Intronic elements in the Na+/I- symporter gene (NIS) interact with retinoic acid receptors and mediate initiation of transcription

Affiliations

Intronic elements in the Na+/I- symporter gene (NIS) interact with retinoic acid receptors and mediate initiation of transcription

Hani Alotaibi et al. Nucleic Acids Res. 2010 Jun.

Abstract

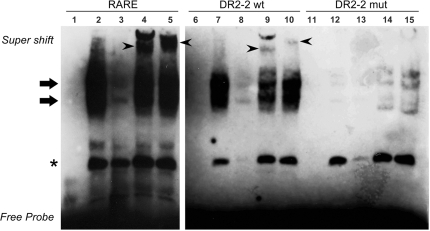
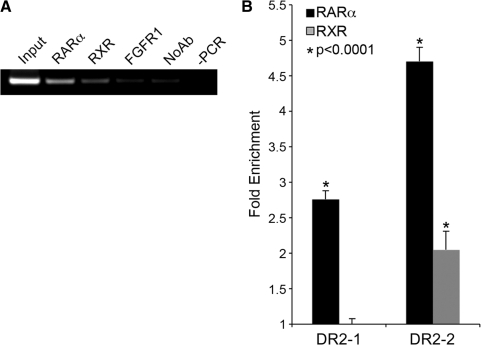
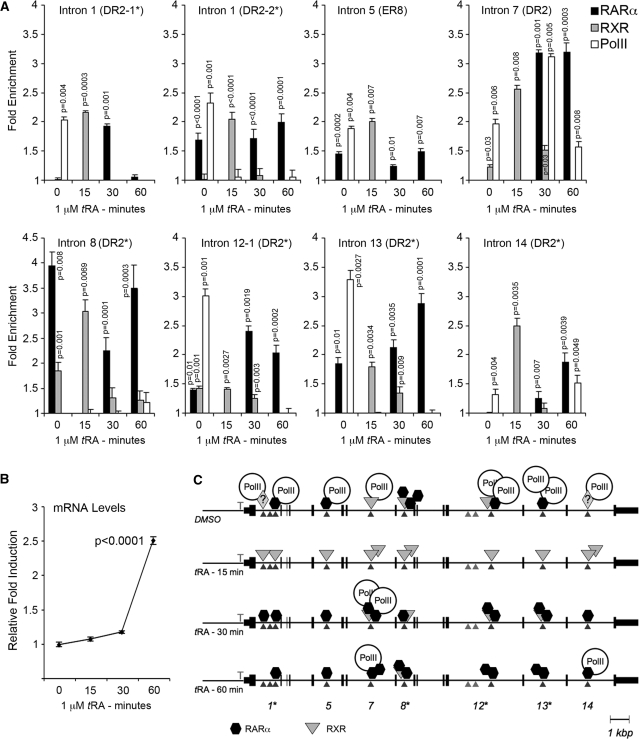
Activity of the sodium/iodide symporter (NIS) in lactating breast is essential for iodide (I(-)) accumulation in milk. Significant NIS upregulation was also reported in breast cancer, indicating a potential use of radioiodide treatment. All-trans-retinoic acid (tRA) is a potent ligand that enhances NIS expression in a subset of breast cancer cell lines and in experimental breast cancer models. Indirect tRA stimulation of NIS in breast cancer cells is very well documented; however, direct upregulation by tRA-activated nuclear receptors has not been identified yet. Aiming to uncover cis-acting elements directly regulating NIS expression, we screened evolutionary-conserved non-coding genomic sequences for responsiveness to tRA in MCF-7. Here, we report that a potent enhancer in the first intron of NIS mediates direct regulation by tRA-stimulated nuclear receptors. In vitro as well as in vivo DNA-protein interaction assays revealed direct association between retinoic acid receptor-alpha (RARalpha) and retinoid-X-receptor (RXR) with this enhancer. Moreover, using chromatin immunoprecipitation (ChIP) we uncovered early events of NIS transcription in response to tRA, which require the interaction of several novel intronic tRA responsive elements. These findings indicate a complex interplay between nuclear receptors, RNA Pol-II and multiple intronic RAREs in NIS gene, and they establish a novel mechanistic model for tRA-induced gene transcription.


Figures

Figure 1.
Figure 1.
VISTA plot of sequence conservation in a 90-kb genomic DNA in human, mouse and rat. Percent nucleotide identities between human, mouse and rat DNA sequences are plotted as a function of position along the human sequence. Peaks of evolutionary conservation in overlapping exonic sequences are shaded blue. Aligned regions of >50% identity over 75 bases are shaded pink. Lines above each alignment indicate the position of the conserved cluster selected for PCR amplification. Only 80 kb of the alignment is shown.
Figure 2.
Figure 2.
Conserved clusters 3 and 4 respond to tRA in MCF-7. Conserved clusters were amplified by PCR and cloned into the luciferase reporter plasmid pGL3-E1b. MCF-7 cells were transfected with all conserved clusters and treated with tRA or DMSO for 24 h. Of the seven clusters analyzed, only clusters 3 and 4 were significantly responsive to tRA treatment. P-values for the tRA-induced samples were calculated using paired Student’s t-test with 95% confidence interval, values <0.05 were considered significant.
Figure 3.
Figure 3.
Stimulation of conserved cluster 3 is indirect and distinct from that in thyroid cells. (A) Map of Cl3, conserved regions are represented by boxes labeled 3-1 to 3-4, the previously characterized RARE is indicated by the black box, the wild type and the mutant sequences are shown below the map. (B) MCF-7 cells were transiently transfected with either the wild type or the mutant construct, cells were treated with tRA or DMSO and luciferase assays were performed. (C) Several deletion mutants were prepared to study the transcriptional potential in response to tRA stimulation of individual or combined conserved regions of Cl3. Plasmids were transfected to MCF-7 cells, followed by tRA (or the vehicle DMSO) treatment for 24 h, then luciferase assays were performed. The luciferase values were normalized to those of Renilla luciferase; fold induction was calculated relative to the empty vector. *Numbers above bars indicate the overall fold stimulation by tRA. P-values for the tRA-induced samples were calculated using paired Student’s t-test with 95% confidence interval, values <0.05 were considered significant.
Figure 4.
Figure 4.
A Functional RARE (DR2-2) is present in the first intron of NIS. (A) Representation of conserved regions and putative RARE sequences in cluster 4. The boxes labeled 4-1 to 4-3 represent the position of the three conserved regions; the positions of putative RARE sequences, transcription start site and the ATG are indicated. Ex 1 and Ex 2 indicate positions of exons 1 and 2, respectively. (B) Sequence representation of the Cl4 variants used, RARE half sites are capitalized and mutated nucleotides are underlined and bolded, deleted nucleotides are replaced with dashes. (C) MCF-7 cells were transiently transfected with Cl4Wt or its mutant derivatives, cells were treated with tRA (or DMSO) for 24 h and luciferase reporter assays were performed. Luciferase values were normalized to those of Renilla luciferase and the fold induction is represented relative to the empty vector. Reporter constructs are presented in the drawing on the left; putative RAREs are indicated by vertical boxes, an X on a box indicates the RARE being altered. P-values were calculated using paired Student’s t-test with 95% confidence interval, values <0.05 were considered significant. (D) MCF-7 cells were transfected with Cl4 controlling either the viral E1b promoter or the native NIS promoter (fragment NIS in Cl3-pm, see ‘Materials and Methods’ section). The sequence for Cl4 was located either 5′ of the promoter, or 3′ of the luciferase reporter. Luciferase assays were performed as mentioned above. Fold stimulation by tRA was calculated relative to the vector containing only the promoter element. P-values were calculated using Student’s t-test with 95% confidence interval, values <0.05 were considered significant. Drawings are not to scale.
Figure 5.
Figure 5.
RARα and RXR interacts with the novel intronic RARE in gel retardation assays. Nuclear extracts from E2-treated MCF-7 cells were incubated with biotin labeled oligonucleotide probes representing a consensus RARE, the wild-type DR2-2 or the mutant variant DR2-2mut (DR2-2-Mut1-S in Supplementary Table S2). Samples were resolved on a 6% non-denaturing polyacrylamide gel in TBE, transferred to Hybond N+ membranes and then incubated with streptavidin, and biotin-labeled DNA probes were detected by chemiluminescence. The name of the probe used in each binding reaction is indicated on the top of each panel. All binding reactions were competed with 200-fold molar excess of the corresponding unlabeled probe. Arrows point out the nuclear receptor–DNA complexes, while arrowheads point out the super shift. The asterisk indicates a DR2-2 independent interaction with nuclear proteins. Labeled probes were incubated in the absence of nuclear extract (lanes 1, 6 and 11), in the presence of nuclear extract alone (lanes 2, 7 and 12), nuclear extract together with an excess of competing unlabeled probe (lanes 3, 8 and 13), in the presence of RARα antibodies (lanes 4, 9 and 14), or in the presence of RXR antibodies (lanes 5, 10 and 15). Experiments were repeated at least three times and a representative result is shown.
Figure 6.
Figure 6.
RARα and RXR occupy the novel intronic element in vivo. MCF-7 cells grown in DMEM were treated with 1 µM tRA and used for ChIP analysis using RARα and RXR specific antibodies. (A) DNA isolated from immunocomplexes was used as a template for PCR amplification using primers specific for DR2-2. PCR products were resolved on a 2% agarose gel (containing Ethidium bromide) and visualized on a UV transilluminator, RARα; anti-RAR-α Ab precipitated DNA, RXR; anti-RXR Ab precipitated DNA, FGFR1; anti-FGFR1 Ab precipitated DNA, No Ab; bead-only control, and -PCR is a negative control with H2O as a template. (B) Quantitative PCR was performed using immunoprecipitated DNA using DR2-1 and DR2-2 specific primers. Ct values were normalized to background levels of bead-only controls (No Ab) using 2(δCt). Data are represented as fold enrichment compared to IgG control. *P-values were calculated using Student’s t-test (average of three experiments) with 95% confidence interval, values <0.05 were considered significant.
Figure 7.
Figure 7.
Nuclear receptors and RNA Pol-II interact with NIS intronic elements in a dynamic manner during the initiation of transcription. MCF-7 cells grown in steroid-free and phenol-red-free DMEM were treated either with DMSO (time 0) or with 1 µM tRA for 15, 30 and 60 min and used for ChIP analysis using RARα and RXR and RNA Pol-II specific antibodies. (A) DNA isolated from immunocomplexes was used for quantitative PCR using primers described in Supplementary Table S3. Ct values were normalized to background levels of bead-only controls. Data are represented as fold enrichment compared to IgG control. (B) mRNA was isolated from a fraction of the cells used for ChIP analysis above. Two micrograms of total RNA was converted to cDNA and used for quantitative real-time PCR. Expression was normalized to the levels of GAPDH using the ΔΔCt method and presented as relative fold induction compared to DMSO-treated samples. (C) Schematic representation of ChIP data depicting the events of transcription initiation of NIS in response to tRA stimulation. Arrow heads indicate the position of the intronic element investigated, vertical small lines represent NIS exons, numbers below indicate introns studied, asterisks above numbers indicate identical sequences. Parallelograms with question mark represent unidentified interacting proteins. DR, direct repeat; ER, everted repeat. Statistical significance was determined by performing the Student’s t-test (Figure 7A) or paired Student’s t-test (Figure 7C) using a 95% confidence interval; P-values <0.05 were considered significant.

Similar articles

Cited by

References

    1. Spitzweg C, Joba W, Eisenmenger W, Heufelder AE. Analysis of human sodium iodide symporter gene expression in extrathyroidal tissues and cloning of its complementary deoxyribonucleic acids from salivary gland, mammary gland, and gastric mucosa. J. Clin. Endocrinol. Metab. 1998;83:1746–1751. - PubMed
    1. Tazebay UH, Wapnir IL, Levy O, Dohan O, Zuckier LS, Zhao QH, Deng HF, Amenta PS, Fineberg S, Pestell RG, et al. The mammary gland iodide transporter is expressed during lactation and in breast cancer. Nat. Med. 2000;6:871–878. - PubMed
    1. Stubbe P, Schulte FJ, Heidemann P. Iodine deficiency and brain development. Bibl. Nutr. Dieta. 1986:206–208. - PubMed
    1. Cho JY, Leveille R, Kao R, Rousset B, Parlow AF, Burak W.E., Jr, Mazzaferri EL, Jhiang SM. Hormonal regulation of radioiodide uptake activity and Na+/I- symporter expression in mammary glands. J. Clin. Endocrinol. Metab. 2000;85:2936–2943. - PubMed
    1. Perron B, Rodriguez AM, Leblanc G, Pourcher T. Cloning of the mouse sodium iodide symporter and its expression in the mammary gland and other tissues. J. Endocrinol. 2001;170:185–196. - PubMed

Publication types