. 2010 Oct;20(10):2496-510.
doi: 10.1093/cercor/bhp319. Epub 2010 Feb 1.

Prefrontal-enriched SLIT1 expression in Old World monkey cortex established during the postnatal development

Affiliations

Prefrontal-enriched SLIT1 expression in Old World monkey cortex established during the postnatal development

Tetsuya Sasaki et al. Cereb Cortex. 2010 Oct.

Abstract

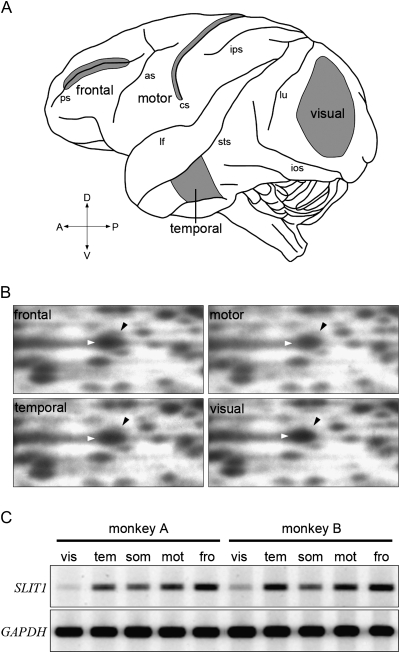
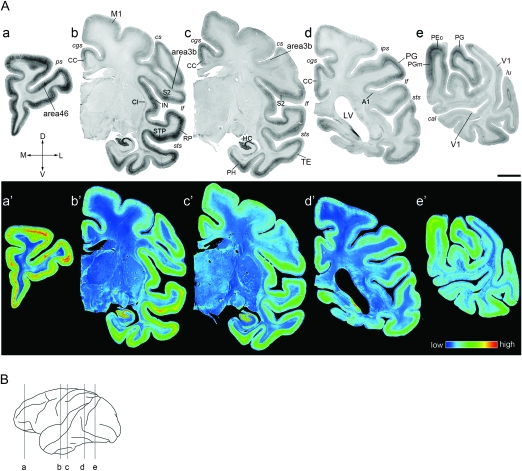
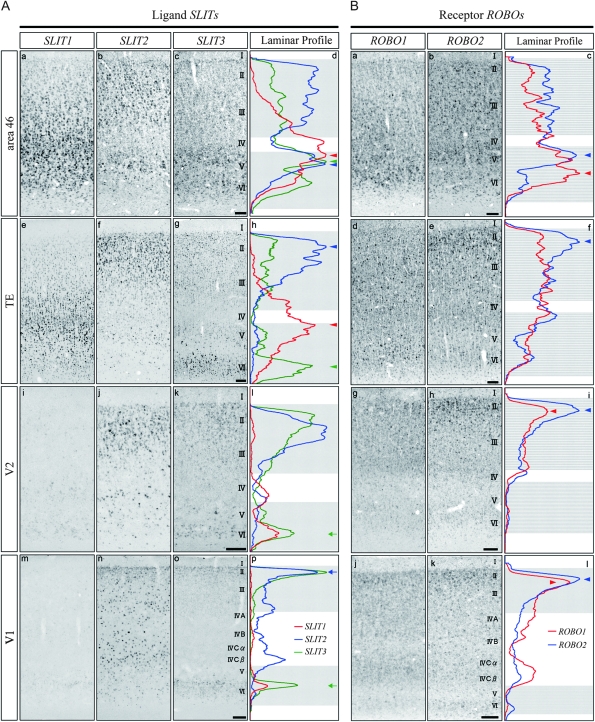
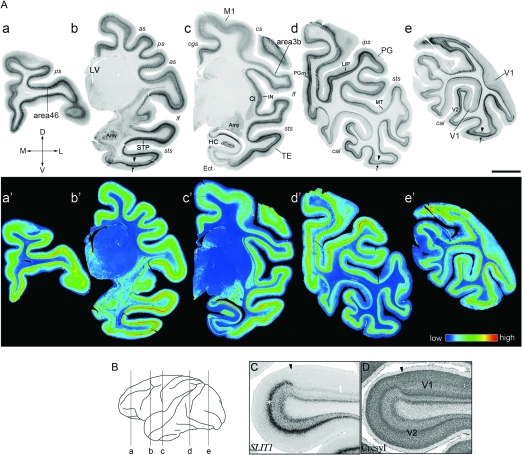
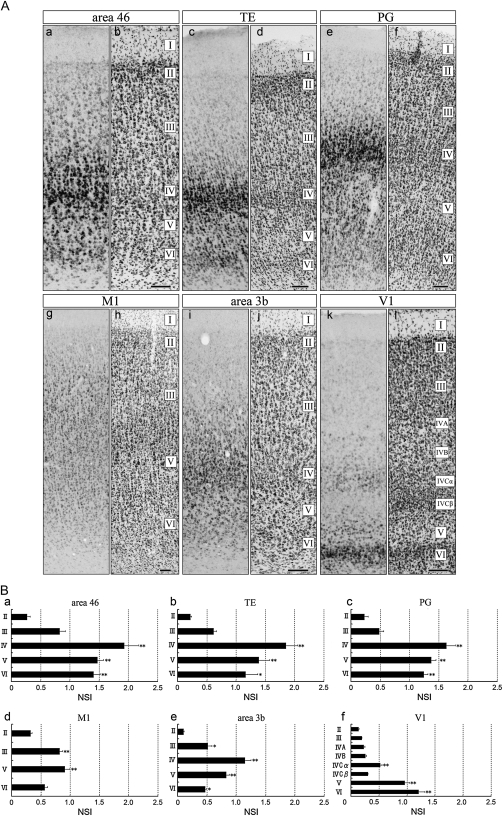
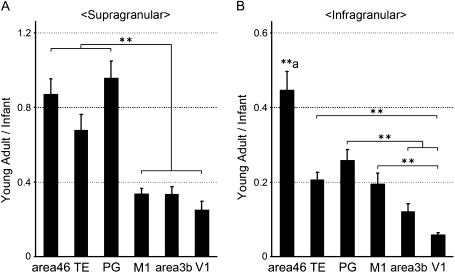
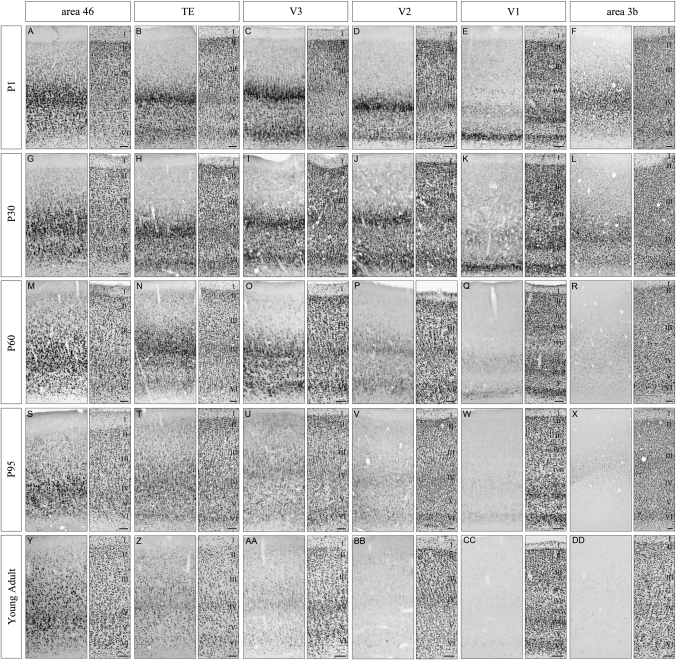
To elucidate the molecular basis of the specialization of cortical architectures, we searched for genes differentially expressed among neocortical areas of Old World monkeys by restriction landmark cDNA scanning . We found that mRNA of SLIT1, an axon guidance molecule, was enriched in the prefrontal cortex but with developmentally related changes. In situ hybridization analysis revealed that SLIT1 mRNA was mainly distributed in the middle layers of most cortical areas, robustly in the prefrontal cortex and faintly in primary sensory areas. The lowest expression was in the primary visual area. Analyses of other SLIT (SLIT2 and SLIT3) mRNAs showed preferential expression in the prefrontal cortex with a distinct laminar pattern. By contrast, the receptor Roundabout (ROBO1 and ROBO2) mRNAs were widely distributed throughout the cortex. Perinatally, SLIT1 mRNA was abundantly expressed in the cortex with modest area specificity. Downregulation of expression initially occurred in early sensory areas around postnatal day 60 and followed in the association areas. The prefrontal area-enriched SLIT1 mRNA expression results from a relatively greater attenuation of this expression in the other areas. These results suggest that its role is altered postnatally and that this is particularly important for prefrontal connectivity in the Old World monkey cortex.


Figures

Figure 1.
Figure 1.
RLCS profiles for 4 different cortical areas. (A) Lateral surface view of a monkey brain. Anterior is to the left and posterior is to the right. Major sulci are indicated by lower case letters: ps, principal sulcus; as, arcuate sulcus; cs, central sulcus; ips, intraparietal sulcus; sts, superior temporal sulcus; ios, inferior occipital sulcus, and lu, lunate sulcus. Samples for RLCS analyses were taken from the 4 cortical areas in gray; frontal, temporal, motor, and visual areas. (B) A cDNA spot for SLIT1 exhibited differential intensity in each of the RLCS gels for the 4 distinct areas of the neocortex depicted in panel A. Each black arrowhead indicates the spot corresponding to SLIT1 cDNA, which is located in the upper right position of the larger spot that is observed in all areas (white arrowheads). Although the spots shown by the white arrowheads were observed in all the areas, the signal intensity of SLIT1 spot in the visual area was lowest. (C) Semiquantitative RT-PCR demonstrated that the SLIT1 mRNA expression level was the highest in the frontal area and lowest in the visual area. Essentially the same result was obtained from 2 different individuals. Glyceraldehyde-3-phosphate dehydrogenase (GAPDH) gene was used as the control for constitutive expression. vis, visual; tem, temporal; mot, motor; fro, frontal; and som, somatosensory areas.
Figure 2.
Figure 2.
ISH Analysis of SLIT1 in Macaque Brain. (A) Coronal sections of a macaque monkey brain were obtained from the positions corresponding to ae in the brain diagram shown in (B). The representative 6 cortical areas (area 46, TE, PG, M1, area 3b, and V1) are magnified in Figure 3. Pseudocolor representations of the same sections in ae are shown in a′–e′. SLIT1 mRNA expression was observed in the entire cerebral cortex at variable levels. Note that the most intense signal was observed in the frontal pole section (a,a′). These images are derived from monkey (B). A1, primary auditory area (core region); M1, primary motor area; V1, primary visual area; CC, cingulate cortex; Cl, claustrum; HC, hippocampus; IN, insular cortex; LV, lateral ventricle; PEc, PE caudal part; PGm, PG medial part; PH, parahippocampal area; RP, rostral parabelt area; STP, superior temporal polysensory area; S2, secondary somatosensory area; cal, calcarine sulcus; cgs, cingulate sulcus; cs, central sulcus; ips, inferior parietal sulcus; lf, lateral fissure; lu, lunate sulcus; ps, principal sulcus; sts, superior temporal sulcus. Orientation of each section is indicated: (D) dorsal; V, ventral; L, lateral; and M, medial. Scale bar = 5 mm. (B) Lateral view of the macaque neocortex. The lines indicate the planes sliced for the sections shown in (A).
Figure 3.
Figure 3.
Layer Distribution of SLIT1 mRNA in Macaque Cortex. (A) Area 46 (a,b), TE (c,d), PG (e,f), M1 (g,h), area 3b (i,j), and V1 (k,l) of macaque cortex. (a,c,e,g,i,k) Coronal sections for ISH. (b,d,f,h,j,l) Coronal sections for cresyl violet staining. In all areas, clear hybridization signals for SLIT1 mRNA were observed in layers II–VI. These images are derived from monkey C. Scale bar = 100 μm. (B) To quantify the hybridization signal level, NSI (SLIT1 OD/cresyl OD ratios) in each of 6 cortical areas (a, area 46; b, TE; c, PG; d, M1; e, area 3b, and f, V1) was calculated (see Materials and Methods for details). The ratios were higher in the middle layers than in layers II or VI except for V1. Three cortices were used for calculation. Asterisks indicate a significant difference from the lowest value in each area (*P < 0.05; **P < 0.01, one-way analysis of variance (ANOVA), n = 9). Data are expressed as mean ± standard error of the mean (SEM). WM, white matter.
Figure 4.
Figure 4.
Differential Laminar Patterns of SLIT and ROBO mRNAs in Macaque Cortex. (A) ISH of SLIT1, SLIT2, and SLIT3 mRNAs in area 46 (a–c), TE (e–g), V2 (i–k), and V1 (m–o), respectively. The laminar profiles of the ISH signals are also shown. Red, blue, and green lines indicate the profiles of SLIT1, SLIT2, and SLIT3 mRNAs, respectively (d,h,l,p). The ISH signals of SLIT mRNAs were strongest in area 46 and weakest in V1. Their laminar patterns showed complementarity in TE. Arrowheads indicate the peaks of ISH signals for SLIT mRNAs in the association areas. Arrows indicate the peaks of the signals in early sensory areas (see in more detail in text). These images are derived from monkey A. (B) ISH of ROBO1 and ROBO2 mRNAs in area 46 (a,b), TE (d,e), V2 (g,h), and V1 (j,k). The laminar profiles of the ISH signals are also shown. Red and blue lines indicate the profiles of ROBO1 and ROBO2 mRNAs (c,f,i,l), respectively. Arrowheads indicate the peaks of ISH signals for ROBO mRNAs. These images are derived from monkey C. Scale bar = 100 μm.
Figure 5.
Figure 5.
ISH Analysis of SLIT1 in Infant Brain. (A) Coronal sections of the P2 macaque brain were obtained from the positions corresponding to the brain diagram as ae in (B). The representative 6 cortical areas (area 46, TE, PG, M1, area 3b, and V1) are magnified in Figure 6. Arrows and arrowheads in b, d, and e indicate the ISH signals at layers IV and VI, respectively. These laminar signals were observed throughout the neocortex. Pseudocolor representation of the same images in ae is shown in a′–e′. as, arcuate sulcus; Ect, entorhinal cortex; LIP, lateral intraparietal area. Other abbreviations are the same as those in Figure 2. The orientation of each section is indicated: D, dorsal; V, ventral; L, lateral; and M, medial. Scale bar = 5 mm. (B) Lateral view of macaque neocortex. The lines indicate the planes sliced for the sections shown in (A). (C) ISH and (D) cresyl violet-stained sections around the V1/V2 border of P2 monkey. Arrowheads indicate the border. Note that the signal intensity observed in the middle layer (*) in V2 markedly decreased in V1.
Figure 6.
Figure 6.
Layer Distribution of SLIT1 mRNA in Infant Cortex. (A) Area 46 (a,b), TE (c,d), PG (e,f), M1 (g,h), area 3b (i,j), and V1 (k,l) of the infant macaque cortex. (a,c,e,g,i,k) Coronal sections for ISH. (b,d,f,h,j,l) Coronal sections for cresyl violet staining. Scale bar = 100 μm. (B) To quantify the hybridization signal level, NSI (SLIT1 OD/cresyl OD ratios) in each of 6 cortical areas was calculated. The ratios were higher in deep layers than in surface layers. The signal intensity of layer VI in V1 was the highest among the layers examined. For this calculation, 3 cortices were used for area 46 (P1, P2, and P30). Two cortices were used for other areas (P1 and P2 for PG; P1 and P30 for TE, M1, area 3b and V1). Asterisks indicate significant difference from the lowest value in each area (*P < 0.05; **P < 0.01, one-way ANOVA, n = 9 for area 46 and n = 6 for other areas). Data are expressed as mean ± SEM. WM, white matter.
Figure 7.
Figure 7.
Alteration of SLIT1 mRNA Distribution between Infant and Young Adult Cortices. (A) Postnatal alteration of SLIT1 mRNA expression in supragranular layers. Each bar represents the ratio of SLIT1 mRNA expression levels between infants (P1, P2, and P30 monkeys) and young adults (monkeys A, B, and C) in supragranular layers (layers II and III) of the 6 cortical areas (young adult/infant). The asterisk indicates significant difference between the ratios in the association areas (area 46, TE, and PG) and those in the primary areas (M1, area 3b, and V1, **P < 0.01, 1-way ANOVA). (B) Postnatal alteration of SLIT1 mRNA expression in infragranular layers. Each bar represents the ratio in infragranular layers (layers V and VI). Asterisks indicate significant difference in each pair (**P < 0.01, 1-way ANOVA). (**a) The ratio in area 46 was significantly higher than those in the remaining areas (P < 0.01). Data are expressed as mean ± SEM.
Figure 8.
Figure 8.
Postnatal Alteration of SLIT1 mRNA Expression in Various Cortical Areas. The expression of SLIT1 mRNA in 6 cortical areas (area 3b, V1, V2, V3, TE, and area 46) at 5 postnatal ages are shown. Coronal sections for ISH of SLIT1 mRNA (left panels) and the adjacent sections for cresyl violet staining (right panels) of the macaque neocortex are shown. (AF) P1, (G–L) P30, (MR) P60, (S–X) P95, and (Y–DD) young adult (monkey C). Scale bar = 100 μm.

Similar articles

Cited by

References

    1. Andrews W, Liapi A, Plachez C, Camurri L, Zhang J, Mori S, Murakami F, Parnavelas JG, Sundaresan V, Richards LJ. Robo1 regulates the development of major axon tracts and interneuron migration in the forebrain. Development. 2006;133:2243–2252. - PubMed
    1. Andrews WD, Barber M, Parnavelas JG. Slit–Robo interactions during cortical development. J Anat. 2007;211:188–198. - PMC - PubMed
    1. Annese J, Gazzaniga MS, Toga AW. Localization of the human cortical visual area MT based on computer aided histological analysis. Cereb Cortex. 2005;15:1044–1053. - PubMed
    1. Bagri A, Marin O, Plump AS, Mak J, Pleasure SJ, Rubenstein JL, Tessier-Lavigne M. Slit proteins prevent midline crossing and determine the dorsoventral position of major axonal pathways in the mammalian forebrain. Neuron. 2002;33:233–248. - PubMed
    1. Bahi A, Dreyer JL. Cocaine-induced expression changes of axon guidance molecules in the adult rat brain. Mol Cell Neurosci. 2005;28:275–291. - PubMed

Publication types

MeSH terms