. 2010 May;115(1):267-85.
doi: 10.1093/toxsci/kfq034. Epub 2010 Feb 1.

Acute exposure to ozone exacerbates acetaminophen-induced liver injury in mice

Affiliations

Acute exposure to ozone exacerbates acetaminophen-induced liver injury in mice

Daher Ibrahim Aibo et al. Toxicol Sci. 2010 May.

Abstract

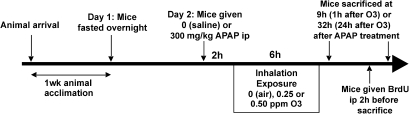
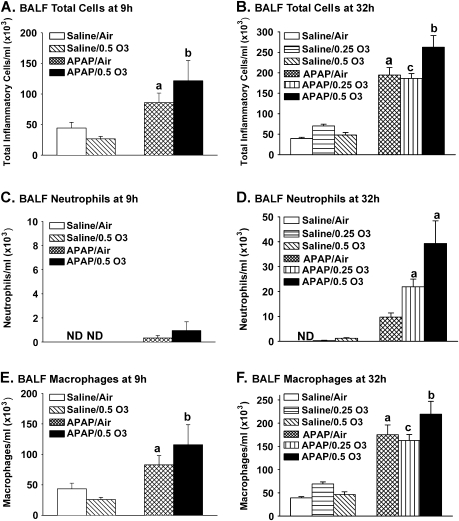
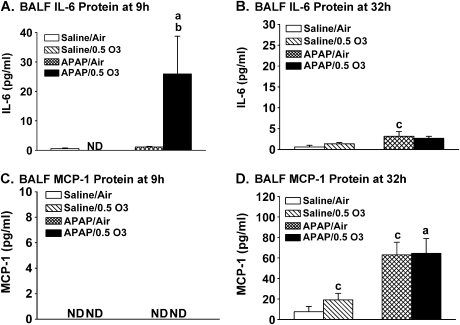
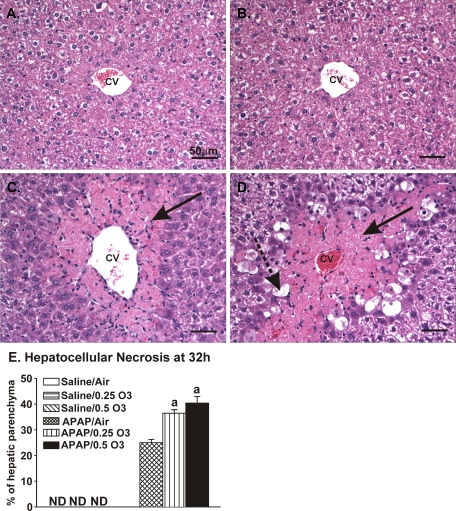
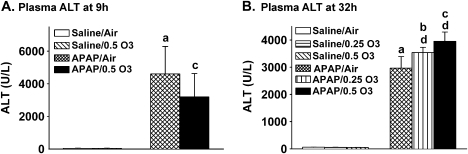
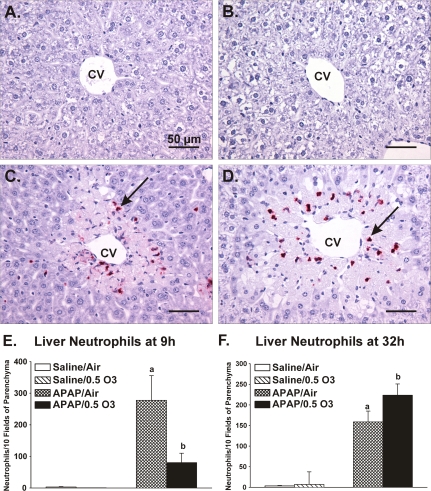
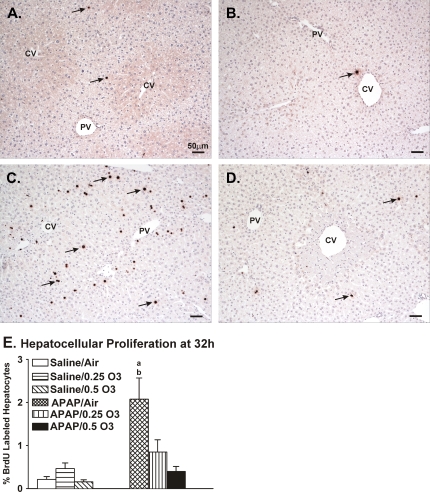
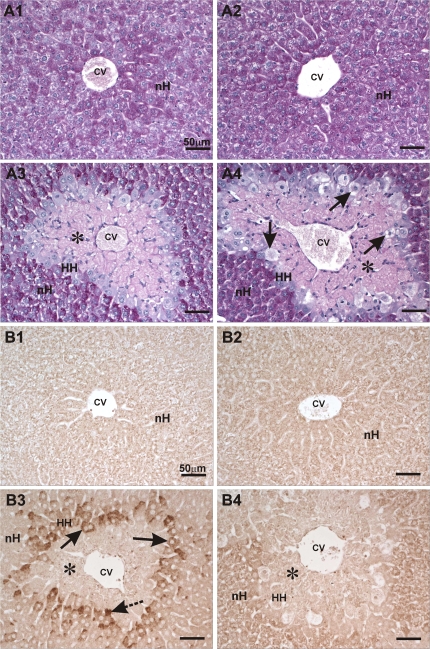
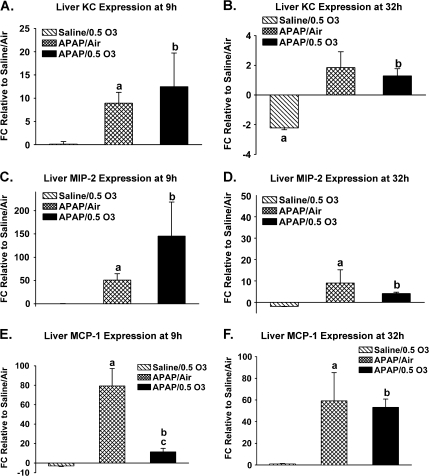
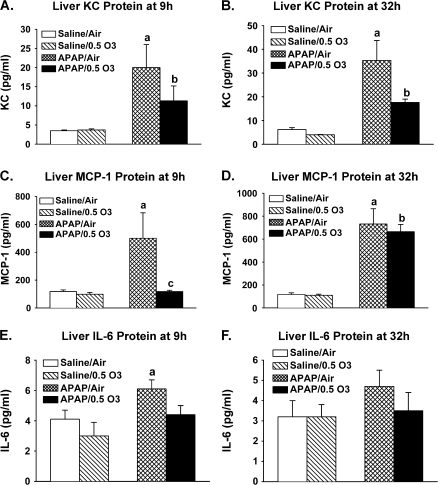
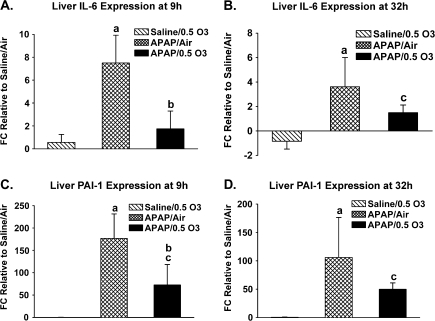
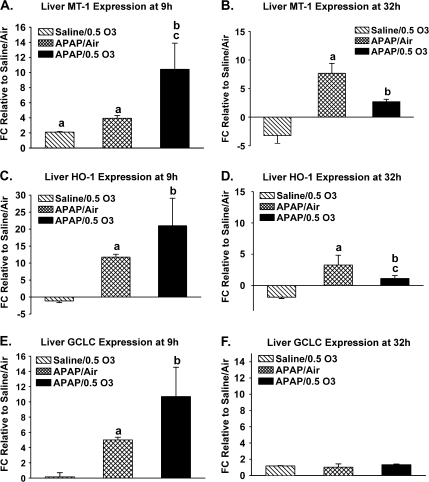
Ozone (O(3)), an oxidant air pollutant in photochemical smog, principally targets epithelial cells lining the respiratory tract. However, changes in gene expression have also been reported in livers of O(3)-exposed mice. The principal aim of the present study was to determine if acute exposure to environmentally relevant concentrations of O(3) could cause exacerbation of drug-induced liver injury in mice. Overdose with acetaminophen (APAP) is the most common cause of drug-induced liver injury in developed countries. In the present study, we examined the hepatic effects of acute O(3) exposure in mice pretreated with a hepatotoxic dose of APAP. C57BL/6 male mice were fasted overnight and then given APAP (300 mg/kg ip) or saline vehicle (0 mg/kg APAP). Two hours later, mice were exposed to 0, 0.25, or 0.5 ppm O(3) for 6 h and then sacrificed 9 or 32 h after APAP administration (1 or 24 h after O(3) exposure, respectively). Animals euthanized at 32 h were given 5-bromo-2-deoxyuridine 2 h before sacrifice to identify hepatocytes undergoing reparative DNA synthesis. Saline-treated mice exposed to either air or O(3) had no liver injury. All APAP-treated mice developed marked centrilobular hepatocellular necrosis that increased in severity with time after APAP exposure. O(3) exposure increased the severity of APAP-induced liver injury as indicated by an increase in necrotic hepatic tissue and plasma alanine aminotransferase activity. O(3) also caused an increase in neutrophil accumulation in livers of APAP-treated animals. APAP induced a 10-fold increase in the number of bromodeoxyuridine-labeled hepatocytes that was markedly attenuated by O(3) exposure. Gene expression analysis 9 h after APAP revealed differential expression of genes involved in inflammation, oxidative stress, and cellular regeneration in mice treated with APAP and O(3) compared to APAP or O(3) alone, providing some indications of the mechanisms behind the APAP and O(3) potentiation. These results suggest that acute exposure to near ambient concentrations of this oxidant air pollutant may exacerbate drug-induced liver injury by delaying hepatic repair.


Figures

FIG. 1.
FIG. 1.
Experimental design. Eight- to 10-week-old C57BL/6 male mice were given 0 (saline) or 300 mg/kg APAP and then exposed to O3 (0, 0.25, or 0.5 ppm) for 6 h. Mice were sacrificed at 9 or 32 h after APAP injection (1 or 24 h after O3 exposure, respectively).
FIG. 2.
FIG. 2.
Inflammatory cell accumulation in BALF of APAP- and/or O3-exposed mice. Animals were given 0 (saline) or 300 mg/kg APAP ip and 2 h later exposed to 0 (air), 0.25 (32 h only), or 0.5 ppm O3 for 6 h. Nine (A, C, and E) or 32 h (B, D, and F) after APAP administration, mice were sacrificed and lungs were lavaged with saline as described in detail in the text. The numbers of inflammatory cells per milliliter in the recovered BALF are graphically presented as total inflammatory cells (A and B), neutrophils (C and D), and macrophages (E and F). Bars represent group means ± SEM (n = 6). a, significantly different from saline/air group; b, significantly different from saline/0.5 ppm O3 group; and c, significantly different from saline/0.25 ppm O3 (p ≤ 0.05).
FIG. 3.
FIG. 3.
IL-6 (A and B) and MCP-1 (C and D) protein concentrations in the BALF of APAP- and/or O3-exposed mice. Animals were given 0 (saline) or 300 mg/kg APAP ip and 2 h later exposed to 0 (air) or 0.5 ppm O3 for 6 h. Nine or 32 h after APAP administration, mice were sacrificed and lungs were lavaged with saline as described in detail in the text. The amount of IL-6 and MCP-1 in the recovered BALF are graphically presented. Bars represent group means ± SEM (n = 6). a, significantly different from saline/0.5 ppm O3 group; b, significantly different from APAP/air group; and c, significantly different from saline/air group (p ≤ 0.05).
FIG. 4.
FIG. 4.
IL-6 (A and B), MCP-1 (C and D), and KC (E and F) protein concentrations in plasma of APAP- and/or O3-exposed mice. Animals were given 0 (saline) or 300 mg/kg APAP ip and 2 h later exposed to 0 (air) or 0.5 ppm O3 for 6 h. Nine or 32 h after APAP administration, animals were sacrificed and blood collected and analyzed as described in detail in the text. Bars represent group means ± SEM (n = 6). a, significantly different from saline/0.5 ppm O3 group; b, significantly different from APAP/air group; and c, significantly different from saline/air group (p ≤ 0.05).
FIG. 5.
FIG. 5.
Hepatic histopathology/morphometry: liver damage induced by APAP and/or O3 exposure 32 h after APAP. Light photomicrographs of liver sections from mice treated with saline/air (A), saline/0.5 ppm O3 (B), APAP/air (C), or APAP/0.5 ppm O3 (D). All tissue sections are stained with H&E. Animals were given 0 (saline) or 300 mg/kg APAP ip and 2 h later exposed to 0 (filtered air), 0.25, or 0.5 ppm O3 for 6 h. Thirty-two hours after APAP administration, mice were euthanized and liver tissues were processed for light microscopy. No histopathology is evident in the livers of control or O3-exposed mice (A and B, respectively). Centrilobular hepatocellular necrosis (solid arrow) surrounding the central vein (CV) is present in the liver of APAP/air mouse (C). Increased amount of hepatocellular necrosis (solid arrow) circumscribed with hepatocytes undergoing ballooning vacuolar degeneration (stippled arrow) is present in the liver section of the APAP/0.5 ppm O3 mouse (D). Graphic representation of the morphometric determinations of the amounts of hepatocellular injury is presented in (E). Bars represent the group means ± SEM (n = 6). a, significantly different from APAP/Air group (p ≤ 0.05).
FIG. 6.
FIG. 6.
Plasma ALT activity in APAP and/or O3-exposed mice 9 h (A) and 32 h (B) after APAP. Nine or 32 h after APAP administration, animals were sacrificed and plasma collected and analyzed for ALT activity as described in detail in the text. Bars represent group means ± SEM (n = 6). a, significantly different from saline/air group; b, significantly different from saline/0.25 ppm O3 group; c, significantly different from saline/0.5 ppm O3; and d, significantly different from APAP/air group (p ≤ 0.05).
FIG. 7.
FIG. 7.
Liver neutrophil infiltration in APAP- and/or O3-exposed mice after APAP. Light photomicrographs of liver sections from mice treated 32 h earlier with saline/air (A), saline/0.5 ppm O3 (B), APAP/air (C) and APAP/0.5 ppm O3 (D). Tissue sections were immunohistochemically stained for infiltrating neutrophils (red chromagen; arrows) and counterstained with hematoxylin as described in detail in the text. Morphometric determinations of the numeric cell density of neutrophils in the hepatic parenchyma are graphically presented in (E and F). Animals were given 0 (saline) or 300 mg/kg APAP ip and 2 h later exposed to 0 (air) or 0.5 ppm O3 for 6 h. Bars in (E and F) represent group means ± SEM (n = 6). a, significantly different from saline/air group and b, significantly different from saline/O3 group (p ≤ 0.05); CV, central vein.
FIG. 8.
FIG. 8.
Hepatocellular proliferation (DNA synthesis) in APAP- and/or O3-exposed mice 32 h after APAP. Light photomicrographs of liver sections from mice treated with saline/air (A), saline/0.5 ppm O3 (B), APAP/air (C), and APAP/0.5 ppm O3 (D). Tissues were immunohistochemically stained for nuclear incorporation of BrdU (brown chromagen; arrows) in hepatocytes undergoing DNA synthesis (cells in S phase of cell cycle). Morphometric determinations of the LI (%) of BrdU-labeled hepatocytes is graphically presented in (E). Mice were given 0 (saline) or 300 mg/kg APAP ip and 2 h later exposed to 0 (air), 0.25, or 0.5 ppm O3 for 6 h. Two hours before sacrifice, mice were injected ip with BrdU. In (E), bars represent group means ± SE (n = 6). a, significantly different from saline/air group and b, significantly different from APAP/O3 groups (p ≤ 0.05). PV, portal vein; CV, central vein.
FIG. 9.
FIG. 9.
Intracellular glycogen (A) and HIF-1α (B) staining 32 h after APAP. Light photomicrographs of liver sections from mice given saline/air (A1 and B1), saline/0.5 ppm O3 (A2 and B2), APAP/air (A3 and B3), and APAP/0.5 ppm O3 (A4 and B4). Mice were given 0 (saline) or 300 mg/kg APAP ip and 2 h later exposed to 0 (air) or 0.5 ppm O3 for 6 h. In (A), all tissue sections were histochemically stained with PAS for glycogen (purple stain) as described in detail in the text. In (B), all tissue sections were immunohistochemically stained for HIF-α (dark brown chromagen) as described in detail in the text. nH, normal hepatocytes; HH, hypertrophic hepatocytes circumscribing areas of hepatocellular necrosis (asterisk); black arrows in (A) indicate hepatocellular vacuolar degeneration of HH; arrows in (B) indicate cytoplasmic or nuclear localization of HIF-α (solid and stippled arrows, respectively); CV, central vein. In APAP-treated mice exposed to air or O3 (A3 and A4, respectively), there is loss of PAS-stained glycogen in the areas of centrilobular necrosis as well as in hypertrophic hepatocytes (HH). In (A4), some of the HH are undergoing vacuolar degeneration. In (B), no HIF-α is present in liver sections (B1 and B2) from saline/air control mouse and saline/0.5 ppm O3 mouse, respectively. In the liver section from the APAP/air mouse (B3), HH circumscribing the areas of centrilobular necrosis (asterisk) contain cytoplasmic and/or nuclear HIF-α (solid arrow and stippled arrow, respectively). In the liver section from the APAP/O3 mouse, there is a loss of HIF-α in the HH undergoing vacuolar degeneration and necrosis.
FIG. 10.
FIG. 10.
KC (A and B), MIP-2 (C and D), and MCP-1 (E and F) gene expression in livers of APAP- and/or O3-exposed mice. Animals were given 0 (saline) or 300 mg/kg APAP ip and 2 h later exposed to 0 (air) or 0.5 ppm O3 for 6 h. Nine or 32 h after APAP administration, mice were sacrificed and liver samples were analyzed by quantitative real-time RT-PCR as described in detail in the text. Bars represent the group means ± SEM (n = 6) of the fold change in mRNA expression relative to that of the saline/air control group. a, significantly different from saline/air group; b, significantly different from saline/0.5 ppm O3 group; and c, significantly different from APAP/air group (p ≤ 0.05).
FIG. 11.
FIG. 11.
KC (A and B), MCP-1 (C and D), and IL-6 (E and F) protein concentrations in livers of APAP- and/or O3-exposed mice. Animals were given 0 (saline) or 300 mg/kg APAP ip and 2 h later exposed to 0 (air) or 0.5 ppm O3 for 6 h. Nine (A, C, and E) or 32 h (B, D, and F) after APAP administration, mice were sacrificed and liver samples were analyzed as described in detail in the text for protein concentrations. Bars represent group means ± SEM (n = 6). a, significantly different from saline/air group; b, significantly different from saline/0.5 ppm O3 group; and c, significantly different from APAP/Air group (p ≤ 0.05).
FIG. 12.
FIG. 12.
IL-6 (A and B) and PAI-1 (C and D) genes expression in livers of APAP- and/or O3-exposed mice. Animals were given 0 (saline) or 300 mg/kg APAP ip and 2 h later exposed to 0 (air) or 0.5 ppm O3 for 6 h. Nine (A and C) or 32 h (B and D) after APAP administration, mice were sacrificed and liver samples were analyzed by quantitative real-time RT-PCR as described in detail in the text. Bars represent the group means ± SEM (n = 6) of the fold change in mRNA expression relative to that of the saline/air control group. Data are expressed as mean ± SE (n = 6). a, significantly different from saline/air group; b, significantly different from APAP/air group; and c, significantly different from saline/O3 group (p ≤ 0.05).
FIG. 13.
FIG. 13.
P21 (A and B) and SOCS3 (C and D) genes expression in APAP- and/or O3-exposed mice. Animals were given 0 (saline) or 300 mg/kg APAP ip and 2 h later exposed to 0 (air) or 0.5 ppm O3 for 6 h. Nine (A and C) or 32 h (B and D) after APAP administration, mice were sacrificed and liver samples were analyzed by quantitative real-time RT-PCR as described in detail in the text. Bars represent the group means ± SEM (n = 6) of the fold change in mRNA expression relative to that of the saline/air control group. a, significantly different from saline/air group; b, significantly different from saline/0.5 ppm O3 group; and c, significantly different from APAP/air group (p ≤ 0.05).
FIG. 14.
FIG. 14.
MT-1 (A and B), HO-1 (C and D), and GCLC (E and F) gene expression in livers of APAP- and/or O3-exposed mice. Animals were given 0 (saline) or 300 mg/kg APAP ip and 2 h later exposed to 0 (air) or 0.5 ppm O3 for 6 h. Nine (A, C, and E) or 32 h (B, D, and F) after APAP administration, mice were sacrificed and liver samples were analyzed by quantitative real-time RT-PCR as described in detail in the text. Bars represent the group means ± SEM (n = 6) of the fold change in mRNA expression relative to that of the saline/air control group. a, significantly different from saline/air group; b, significantly different from saline/0.5 ppm O3 group; and c, significantly different from APAP/air group (p ≤ 0.05).
FIG. 15.
FIG. 15.
Total (A) or oxidized (B) glutathione and TBARS (C and D) concentrations in livers of APAP- and/or O3-exposed mice. Animals were given 0 (saline) or 300 mg/kg APAP ip and 2 h later exposed to 0 (air) or 0.5 ppm O3 for 6 h. Nine (A, B, and C) or 32 h (D) after APAP administration, mice were sacrificed and liver samples were processed for analytical determination of glutathione (GSH and GSSG) and TBARS concentrations by standard assays described in detail in the text. Bars represent the group means ± SEM (n = 6). a, significantly different from saline/air group; b, significantly different from saline/0.5 ppm O3 group; and c, significantly different from APAP/air group (p ≤ 0.05).

References

    1. Amimoto T, Matsura T, Koyama SY, Nakanishi T, Yamada K, Kajiyama G. Acetaminophen-induced hepatic injury in mice: the role of lipid peroxidation and effects of pretreatment with coenzyme Q10 and alpha-tocopherol. Free Radic. Biol. Med. 1995;19:169–176. - PubMed
    1. Araujo JA, Barajas B, Kleinman M, Wang X, Bennett BJ, Gong KW, Navab M, Harkema J, Sioutas C, Lusis AJ, et al. Ambient particulate pollutants in the ultrafine range promote early atherosclerosis and systemic oxidative stress. Circ. Res. 2008;102:589–596. - PMC - PubMed
    1. Bajt ML, Yan HM, Farhood A, Jaeschke H. Plasminogen activator inhibitor-1 limits liver injury and facilitates regeneration after acetaminophen overdose. Toxicol. Sci. 2008;104:419–427. - PMC - PubMed
    1. Bell ML, McDermott A, Zeger SL, Samet JM, Dominici F. Ozone and short-term mortality in 95 US urban communities, 1987–2000. JAMA. 2004;292:2372–2378. - PMC - PubMed
    1. Bornholdt J, Dybdahl M, Vogel U, Hansen M, Loft S, Wallin H. Inhalation of ozone induces DNA strand breaks and inflammation in mice. Mutat. Res. 2002;520:63–71. - PubMed

Publication types

MeSH terms