

Corticospinal contribution to arm muscle activity during human walking
- PMID: 20123782
- PMCID: PMC2849962
- DOI: 10.1113/jphysiol.2009.185520
Corticospinal contribution to arm muscle activity during human walking
Abstract
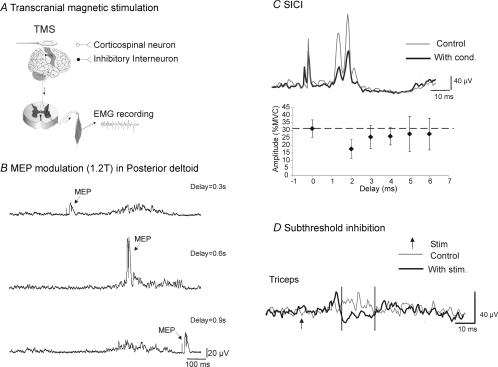
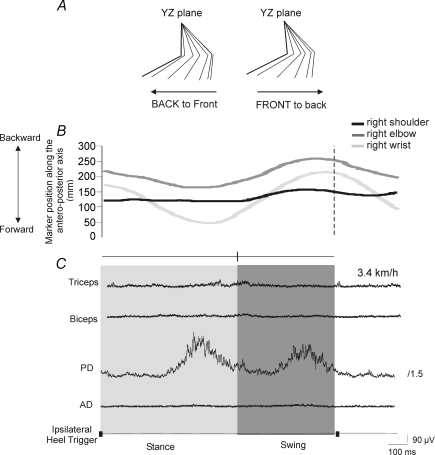
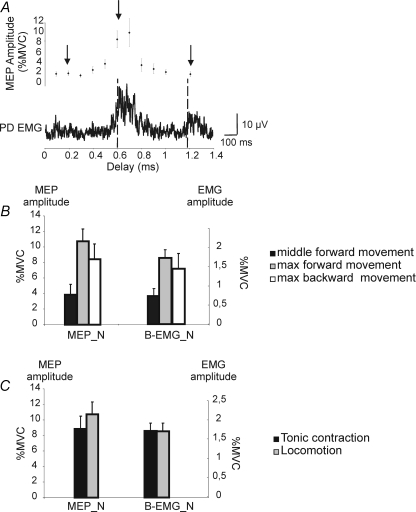
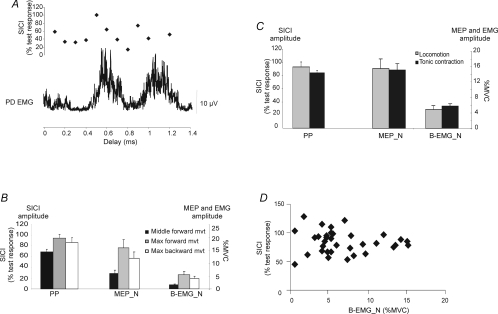
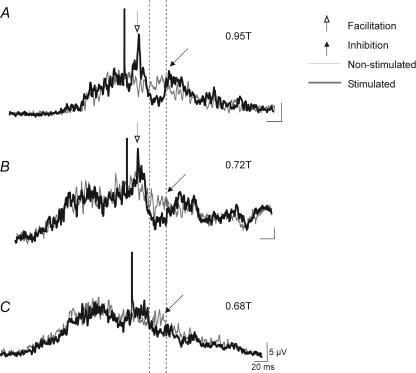
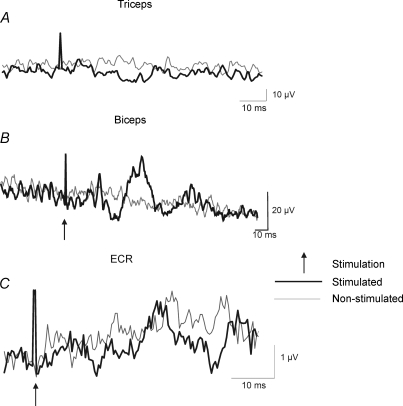
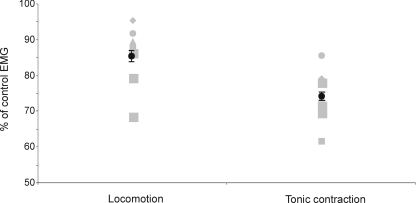
When we walk, our arm muscles show rhythmic activity suggesting that the central nervous system contributes to the swing of the arms. The purpose of the present study was to investigate whether corticospinal drive plays a role in the control of arm muscle activity during human walking. Motor evoked potentials (MEPs) elicited in the posterior deltoid muscle (PD) by transcranial magnetic stimulation (TMS) were modulated during the gait cycle in parallel with changes in the background EMG activity. There was no significant difference in the size of the MEPs at a comparable level of background EMG during walking and during static PD contraction. Short latency intracortical inhibition (SICI; 2 ms interval) studied by paired-pulse TMS was diminished during bursts of PD EMG activity. This could not be explained only by changes in background EMG activity and/or control MEP size, since SICI showed no correlation to the level of background EMG activity during static PD contraction. Finally, TMS at intensity below the threshold for activation of corticospinal tract fibres elicited a suppression of the PD EMG activity during walking. Since TMS at this intensity is likely to only activate intracortical inhibitory interneurones, the suppression is in all likelihood caused by removal of a corticospinal contribution to the ongoing EMG activity. The data thus suggest that the motor cortex makes an active contribution, through the corticospinal tract, to the ongoing EMG activity in arm muscles during walking.
Figures
Comment in
-
Swing those arms: automatic movement controlled by the cerebral cortex.J Physiol. 2010 Apr 1;588(Pt 7):1029-30. doi: 10.1113/jphysiol.2010.188649. J Physiol. 2010. PMID: 20360024 Free PMC article. No abstract available.
Similar articles
-
Corticospinal inhibition of transmission in propriospinal-like neurones during human walking.Eur J Neurosci. 2008 Oct;28(7):1351-61. doi: 10.1111/j.1460-9568.2008.06414.x. Eur J Neurosci. 2008. PMID: 18973562
-
Rapid changes in corticospinal excitability during force field adaptation of human walking.Exp Brain Res. 2012 Mar;217(1):99-115. doi: 10.1007/s00221-011-2977-4. Epub 2012 Jan 13. Exp Brain Res. 2012. PMID: 22246104
-
Effects of low-frequency whole-body vibration on motor-evoked potentials in healthy men.Exp Physiol. 2009 Jan;94(1):103-16. doi: 10.1113/expphysiol.2008.042689. Epub 2008 Jul 25. Exp Physiol. 2009. PMID: 18658234
-
Stimulation of the motor cortex and corticospinal tract to assess human muscle fatigue.Neuroscience. 2013 Feb 12;231:384-99. doi: 10.1016/j.neuroscience.2012.10.058. Epub 2012 Nov 3. Neuroscience. 2013. PMID: 23131709 Review.
-
Contributions to the understanding of gait control.Dan Med J. 2014 Apr;61(4):B4823. Dan Med J. 2014. PMID: 24814597 Review.
Cited by
-
The neural mechanisms of manual dexterity.Nat Rev Neurosci. 2021 Dec;22(12):741-757. doi: 10.1038/s41583-021-00528-7. Epub 2021 Oct 28. Nat Rev Neurosci. 2021. PMID: 34711956 Free PMC article. Review.
-
Early manifestation of arm-leg coordination during stepping on a surface in human neonates.Exp Brain Res. 2018 Apr;236(4):1105-1115. doi: 10.1007/s00221-018-5201-y. Epub 2018 Feb 13. Exp Brain Res. 2018. PMID: 29441470
-
A common neural element receiving rhythmic arm and leg activity as assessed by reflex modulation in arm muscles.J Neurophysiol. 2016 Apr;115(4):2065-75. doi: 10.1152/jn.00638.2015. Epub 2016 Mar 9. J Neurophysiol. 2016. PMID: 26961103 Free PMC article.
-
Control of Mammalian Locomotion by Somatosensory Feedback.Compr Physiol. 2021 Dec 29;12(1):2877-2947. doi: 10.1002/cphy.c210020. Compr Physiol. 2021. PMID: 34964114 Free PMC article.
-
Using Cutaneous Receptor Vibration to Uncover the Effect of Transcranial Magnetic Stimulation (TMS) on Motor Cortical Excitability.Med Sci Monit. 2020 May 27;26:e923166. doi: 10.12659/MSM.923166. Med Sci Monit. 2020. PMID: 32459795 Free PMC article.
References
-
- Ballesteros ML, Buchthal F, Rosenfalck P. The pattern of muscular activity during the arm swing of natural walking. Acta Physiol Scand. 1965;63:296–310. - PubMed
-
- Barthélemy D, Korchi M, Nielsen JB. Society for the Neural Control of Movement. Spain: 2007a. Corticospinal drive contributes to arm muscle activity during human walking (abstract)
-
- Barthélemy D, Korchi M, Nielsen JB. International Society for Posture and Gait Research (ISPGR) USA: 2007b. Corticospinal drive contributes to arm muscle activity during human walking (abstract)
-
- Barthélemy D, Nielsen JB. Third International Conference on Transcranial Magnetic and Direct Current Stimulation. Germany: 2008. Contribution of the corticospinal tract to arm muscle activity during human walking (abstract)
Publication types
MeSH terms
Grants and funding
LinkOut - more resources
Full Text Sources