

Synchronized bursts of miniature inhibitory postsynaptic currents
- PMID: 20123785
- PMCID: PMC2849960
- DOI: 10.1113/jphysiol.2009.181461
Synchronized bursts of miniature inhibitory postsynaptic currents
Abstract
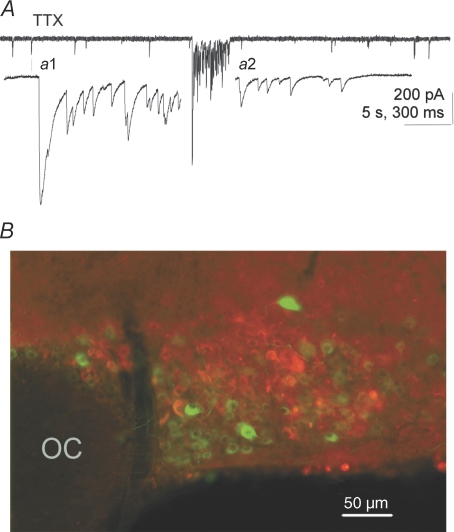
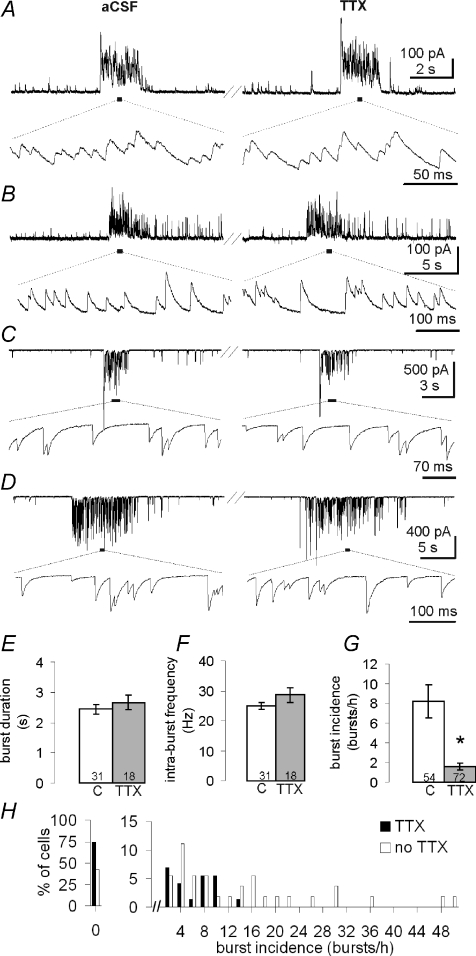
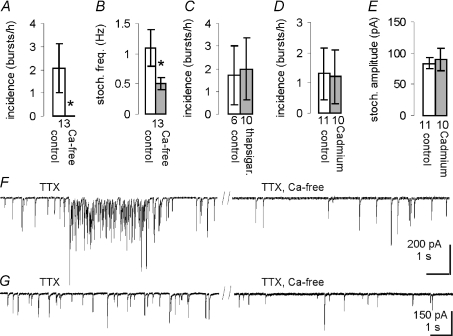
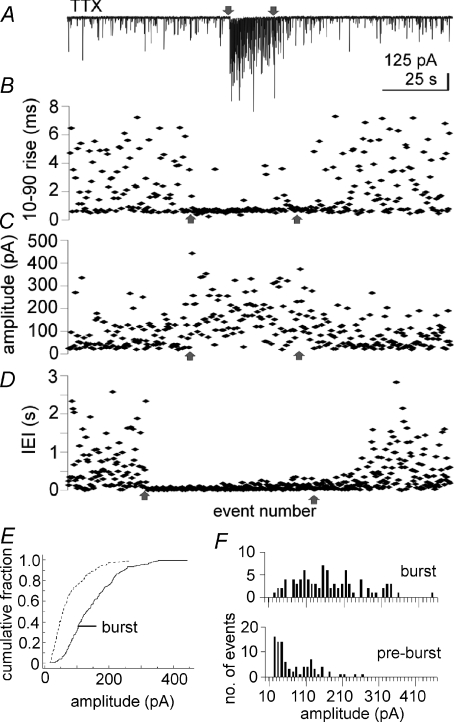
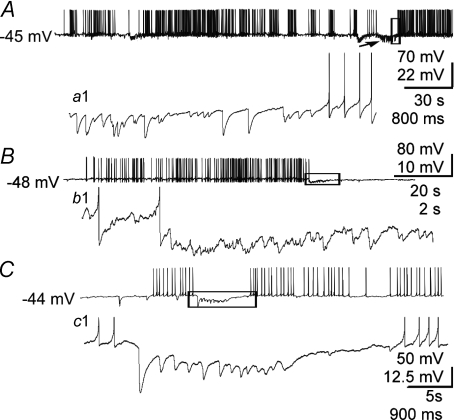
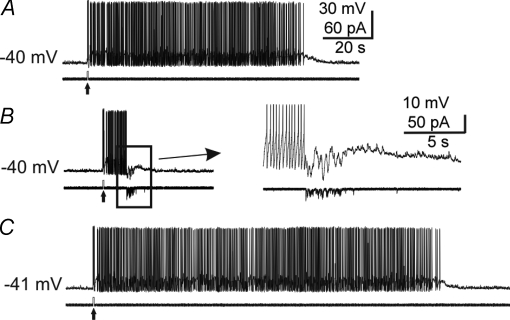
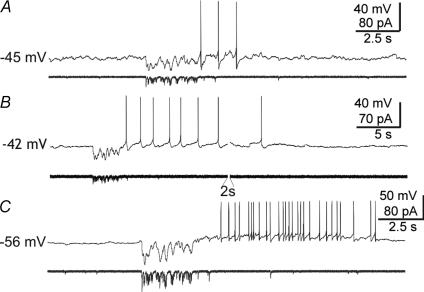
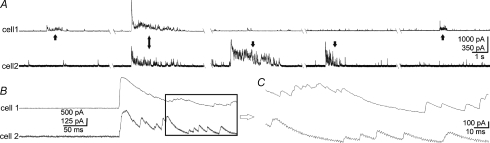
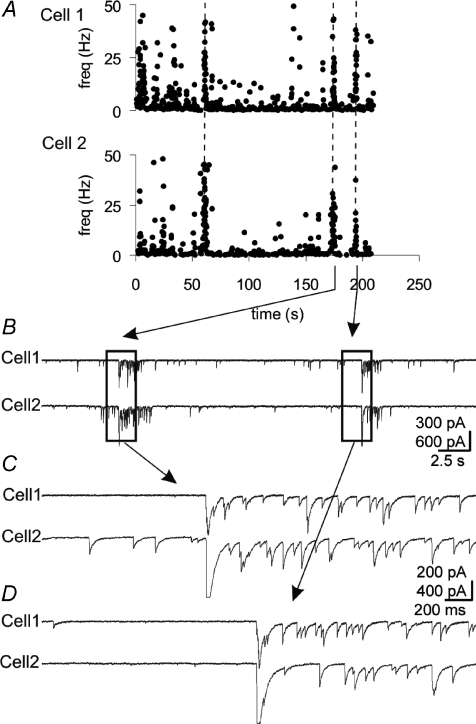
Spike-independent miniature postsynaptic currents are generally stochastic and are therefore not thought to mediate information relay in neuronal circuits. However, we recorded endogenous bursts of IPSCs in hypothalamic magnocellular neurones in the presence of TTX, which implicated a coordinated mechanism of spike-independent GABA release. IPSC bursts were identical in the absence of TTX, although the burst incidence increased 5-fold, indicating that IPSC bursts were composed of miniature IPSCs (mIPSCs), and that the probability of burst generation increased with action potential activity. IPSC bursts required extracellular calcium, although they were not dependent on calcium influx through voltage-gated calcium channels or on calcium mobilization from intracellular stores. Current injections simulating IPSC bursts were capable of triggering and terminating action potential trains. In 25% of dual recordings, a subset of IPSC bursts were highly synchronized in onset in pairs of magnocellular neurones. Synchronized IPSC bursts displayed properties that were consistent with simultaneous release at GABA synapses shared between pairs of postsynaptic magnocellular neurones. Synchronized bursts of inhibitory synaptic inputs represent a novel mechanism that may contribute to the action potential burst generation, termination and synchronization responsible for pulsatile hormone release from neuroendocrine cells.
Figures
Comment in
-
An encounter of the third kind without the usual suspects: coherent activation of asynchronous transmitter release independent of presynaptic excitation.J Physiol. 2010 Apr 1;588(Pt 7):1031. doi: 10.1113/jphysiol.2010.188599. J Physiol. 2010. PMID: 20360025 Free PMC article. No abstract available.
Similar articles
-
Lactation induces increased IPSC bursting in oxytocinergic neurons.Physiol Rep. 2019 Apr;7(8):e14047. doi: 10.14814/phy2.14047. Physiol Rep. 2019. PMID: 31008554 Free PMC article.
-
Homeostatic presynaptic suppression of neuronal network bursts.J Neurophysiol. 2009 Apr;101(4):2077-88. doi: 10.1152/jn.91085.2008. Epub 2009 Feb 4. J Neurophysiol. 2009. PMID: 19193770
-
Periodic synchronized bursting and intracellular calcium transients elicited by low magnesium in cultured cortical neurons.J Neurophysiol. 1993 Oct;70(4):1606-16. doi: 10.1152/jn.1993.70.4.1606. J Neurophysiol. 1993. PMID: 8283217
-
Neurotrophin-3 potentiates excitatory GABAergic synaptic transmission in cultured developing hypothalamic neurones of the rat.J Physiol. 1999 Jul 1;518(Pt 1):81-95. doi: 10.1111/j.1469-7793.1999.0081r.x. J Physiol. 1999. PMID: 10373691 Free PMC article.
-
Quantal analysis of inhibitory synaptic transmission in the dentate gyrus of rat hippocampal slices: a patch-clamp study.J Physiol. 1990 Nov;430:213-49. doi: 10.1113/jphysiol.1990.sp018289. J Physiol. 1990. PMID: 1707966 Free PMC article.
Cited by
-
Depolarising and hyperpolarising actions of GABA(A) receptor activation on gonadotrophin-releasing hormone neurones: towards an emerging consensus.J Neuroendocrinol. 2011 Jul;23(7):557-69. doi: 10.1111/j.1365-2826.2011.02145.x. J Neuroendocrinol. 2011. PMID: 21518033 Free PMC article. Review.
-
Cannabinoid receptor agonists potentiate action potential-independent release of GABA in the dentate gyrus through a CB1 receptor-independent mechanism.J Physiol. 2011 Aug 1;589(Pt 15):3801-21. doi: 10.1113/jphysiol.2011.211482. Epub 2011 Jun 6. J Physiol. 2011. PMID: 21646412 Free PMC article.
-
Lactation induces increased IPSC bursting in oxytocinergic neurons.Physiol Rep. 2019 Apr;7(8):e14047. doi: 10.14814/phy2.14047. Physiol Rep. 2019. PMID: 31008554 Free PMC article.
-
GABAergic Interneuron and Neurotransmission Are mTOR-Dependently Disturbed in Experimental Focal Cortical Dysplasia.Mol Neurobiol. 2021 Jan;58(1):156-169. doi: 10.1007/s12035-020-02086-y. Epub 2020 Sep 10. Mol Neurobiol. 2021. PMID: 32909150
-
Glucocorticoid exerts its non-genomic effect on IPSC by activation of a phospholipase C-dependent pathway in prefrontal cortex of rats.J Physiol. 2013 Jul 1;591(13):3341-53. doi: 10.1113/jphysiol.2013.254961. Epub 2013 May 7. J Physiol. 2013. PMID: 23652592 Free PMC article.
References
-
- Andrew RD, Dudek FE. Analysis of intracellularly recorded phasic bursting by mammalian neuroendocrine cells. J Neurophysiol. 1984;51:552–566. - PubMed
-
- Auger C, Marty A. Heterogeneity of functional synaptic parameters among single release sites. Neuron. 1997;19:139–150. - PubMed
-
- Belin V, Moos F, Richard P. Synchronization of oxytocin cells in the hypothalamic paraventricular and supraoptic nuclei in suckled rats: direct proof with paired extracellular recordings. Exp Brain Res. 1984;57:201–203. - PubMed
Publication types
MeSH terms
Substances
Grants and funding
LinkOut - more resources
Full Text Sources