. 2010 Mar 15;588(Pt 6):981-93.
doi: 10.1113/jphysiol.2009.183897. Epub 2010 Feb 1.

Differential roles of regulatory light chain and myosin binding protein-C phosphorylations in the modulation of cardiac force development

Affiliations

Differential roles of regulatory light chain and myosin binding protein-C phosphorylations in the modulation of cardiac force development

Brett A Colson et al. J Physiol. .

Abstract

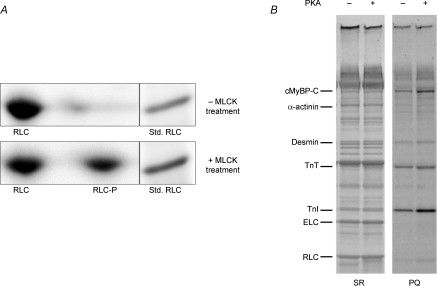
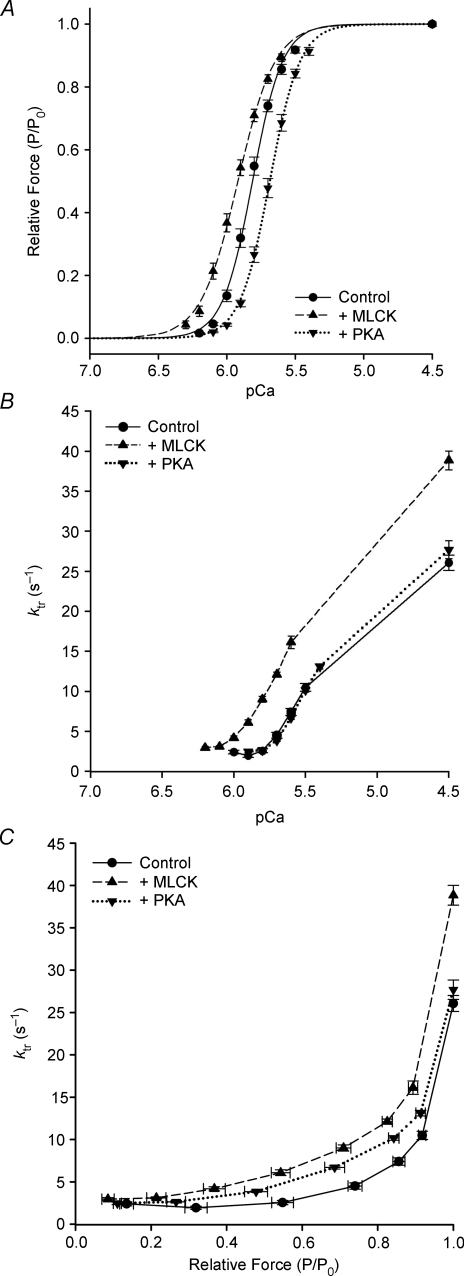
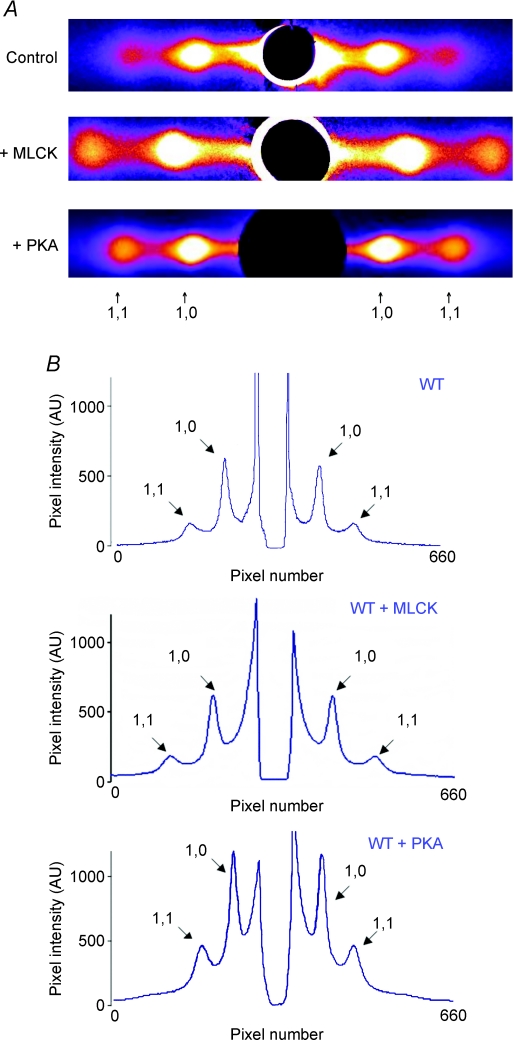
Phosphorylation of myosin regulatory light chain (RLC) by myosin light chain kinase (MLCK) and myosin binding protein-C (cMyBP-C) by protein kinase A (PKA) independently accelerate the kinetics of force development in ventricular myocardium. However, while MLCK treatment has been shown to increase the Ca(2+) sensitivity of force (pCa(50)), PKA treatment has been shown to decrease pCa(50), presumably due to cardiac troponin I phosphorylation. Further, MLCK treatment increases Ca(2+)-independent force and maximum Ca(2+)-activated force, whereas PKA treatment has no effect on either force. To investigate the structural basis underlying the kinase-specific differential effects on steady-state force, we used synchrotron low-angle X-ray diffraction to compare equatorial intensity ratios (I(1,1)/I(1,0)) to assess the proximity of myosin cross-bridge mass relative to actin and to compare lattice spacings (d(1,0)) to assess the inter-thick filament spacing in skinned myocardium following treatment with either MLCK or PKA. As we showed previously, PKA phosphorylation of cMyBP-C increases I(1,1)/I(1,0) and, as hypothesized, treatment with MLCK also increased I(1,1)/I(1,0), which can explain the accelerated rates of force development during activation. Importantly, interfilament spacing was reduced by 2 nm (3.5%) with MLCK treatment, but did not change with PKA treatment. Thus, RLC or cMyBP-C phosphorylation increases the proximity of cross-bridges to actin, but only RLC phosphorylation affects lattice spacing, which suggests that RLC and cMyBP-C modulate the kinetics of force development by similar structural mechanisms; however, the effect of RLC phosphorylation to increase the Ca(2+) sensitivity of force is mediated by a distinct mechanism, most probably involving changes in interfilament spacing.


Figures

Figure 1
Figure 1
Phosphate incorporation into myofibrillar proteins of skinned murine myocardium following treatment with MLCK or PKA A, SYPRO Ruby-stained two-dimensional SDS–PAGE/IEF gels were used to determine percentage phosphorylation of RLC in skinned myocardium, as shown in these representative gels. The gel in the top panel shows that 2,3-butanedione monoxime (BDM) resulted in little or no detectable phosphorylation of RLC (one spot; RLC), while the gel in the bottom panel shows that subsequent treatment with MLCK resulted in significant phosphorylation of RLC (two spots; RLC and RLC-P). Densitometric scans of the two RLC spots in the gels indicated that ∼40% of total RLC was phosphorylated (RLC-P), consistent with in vivo levels reported previously (Holroyde et al. 1979). When the 2nd dimension was run, a myofibrillar preparation was run in an adjacent lane as a molecular weight standard for RLC. B, SYPRO Ruby- (SR) and Pro-Q Diamond- (PQ) stained gels were used to determine levels of myofibrillar protein phosphorylation with (+) and without (−) PKA treatment, as shown in this representative 10% SDS–PAGE: SR, stained gel for relative abundance of proteins; PQ, stained gel specific for relative abundance of phosphorylated proteins. PKA induced significant incorporation of phosphate in cTnI and cMyBP-C in myocardium. Cardiac troponin T (cTnT), cardiac troponin I (cTnI), myosin essential light chain (ELC) and RLC are also labelled.
Figure 2
Figure 2
Effects of MLCK and PKA treatment on Ca2+ sensitivity of force and apparent cooperativity in murine skinned myocardium Force–pCa relationships were measured in skinned myocardium that was untreated (control; filled circles) or treated with either MLCK (filled upward triangles) or PKA (filled downward triangles). Fitting the mean data with the Hill equation yielded: pCa50= 5.81 and nH= 4.09 for control (continuous line), pCa50= 5.92 and nH= 3.20 for MLCK-treated (dashed line) and pCa50= 5.69 and nH= 3.96 for PKA-treated (dotted line) myocardium. B, ktr–pCa relationships in murine skinned myocardium. A ktr–pCa relationship was obtained by initially activating the skinned myocardium in solution of pCa 4.5, and then in a series of submaximally activating solutions between pCa 6.2 and 5.4. To assess any decline in the maximal rate of force development, the preparation was activated with solution of pCa 4.5 at the end of each experimental protocol, which was less than 10%. The reference value of maximal ktr for each activation was obtained by interpolation between the initial and final measurements of maximal ktr. The apparent rate constants of force redevelopment (ktr) were estimated by linear transformation of the half-time of force redevelopment, i.e. ktr= 0.693/t1/2, as described previously (Regnier 1998; Fitzsimons 2001b). C, ktr–relative force relationships in murine skinned myocardium. Data are shown with force expressed relative to the maximum force for each condition. ktr–normalized force relationships were measured in control (filled circles), MLCK-treated (filled upward triangles) and PKA-treated (filled downward triangles) preparations. Relative force was calculated by normalizing force values at each pCa to the maximum force value in solution of pCa 4.5 for each of the unpaired treatment groups.
Figure 3
Figure 3
Effects of MLCK and PKA treatments on intensities and spacings of 1,0 and 1,1 equatorial peaks in WT skinned myocardium A, X-ray diffraction patterns from skinned myocardium that was untreated (control; top panel) or treated with either MLCK (middle panel) or PKA (bottom panel). The ratio of intensities of the 1,0 and 1,1 equatorial reflections can be used to estimate shifts of cross-bridge mass from the region of the thick filament to the region of the thin filament. B, representative intensity traces along the equator of X-ray patterns of skinned myocardium that was untreated (control; top panel) or treated with either MLCK (middle panel) or PKA (bottom panel). The pixel intensity along the y-axis is labelled from 0 to 1000 arbitrary units and the peak profiles were not otherwise modified.

References

    1. Brenner B, Eisenberg E. Rate of force generation in muscle: correlation with actomyosin ATPase activity in solution. Proc Natl Acad Sci U S A. 1986;83:3542–3546. - PMC - PubMed
    1. Chan JY, Takeda M, Briggs LE, Graham ML, Lu JT, Horikoshi N, Weinberg EO, Aoki H, Sato N, Chien KR, Kasahara H. Identification of cardiac-specific myosin light chain kinase. Circ Res. 2008;102:571–580. - PMC - PubMed
    1. Chandra M, Dong WJ, Pan BS, Cheung HC, Solaro RJ. Effects of protein kinase A phosphorylation on signalling between cardiac troponin I and the N-terminal domain of cardiac troponin C. Biochemistry. 1997;36:13305–13311. - PubMed
    1. Chase PB, Martyn DA, Hannon JD. Isometric force redevelopment of skinned muscle fibres from rabbit activated with and without Ca2+ Biophys J. 1994;67:1994–2001. - PMC - PubMed
    1. Colson BA, Bekyarova T, Fitzsimons DP, Irving TC, Moss RL. Radial displacement of myosin cross-bridges in mouse myocardium due to ablation of myosin binding protein-C. J Mol Biol. 2007;367:36–41. - PMC - PubMed

Publication types

MeSH terms