

Loss of thymidine kinase 2 alters neuronal bioenergetics and leads to neurodegeneration
- PMID: 20123860
- PMCID: PMC2850617
- DOI: 10.1093/hmg/ddq043
Loss of thymidine kinase 2 alters neuronal bioenergetics and leads to neurodegeneration
Abstract
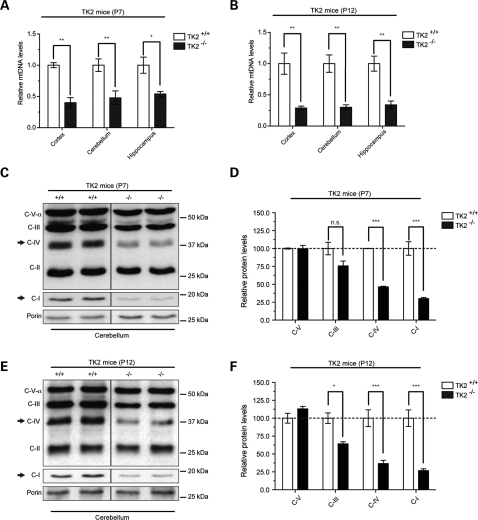
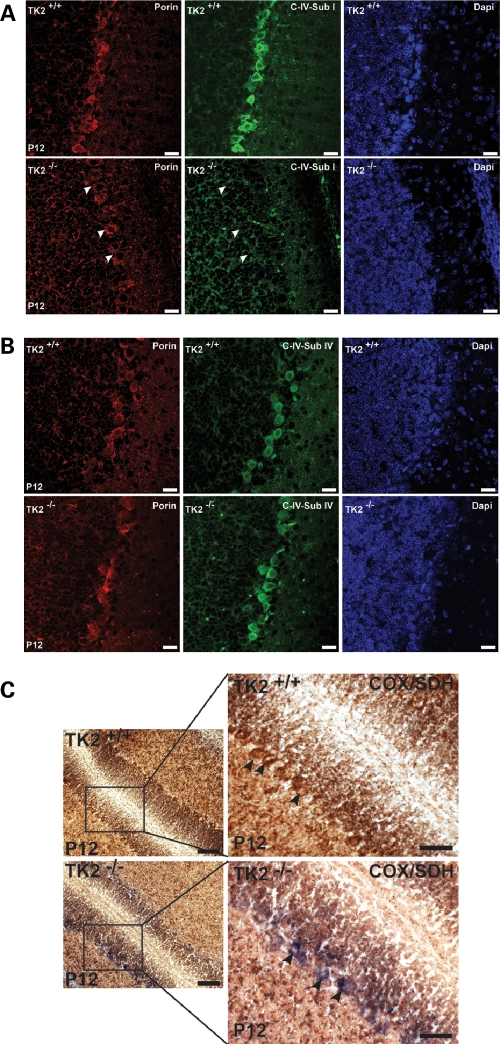
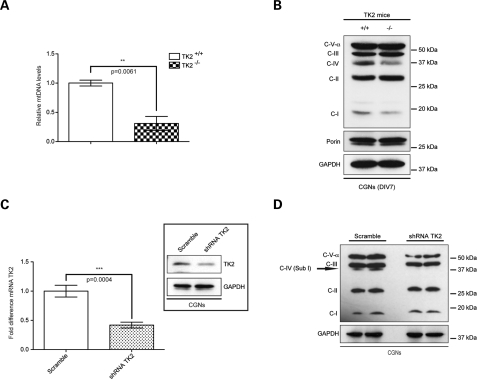
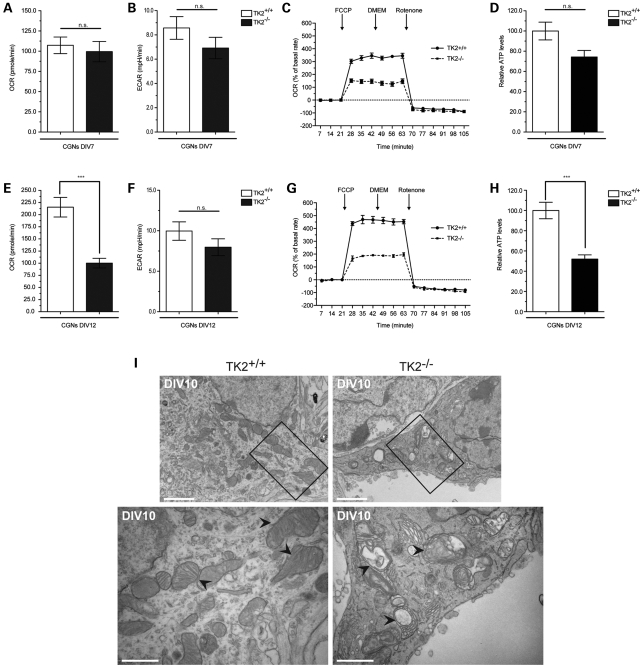
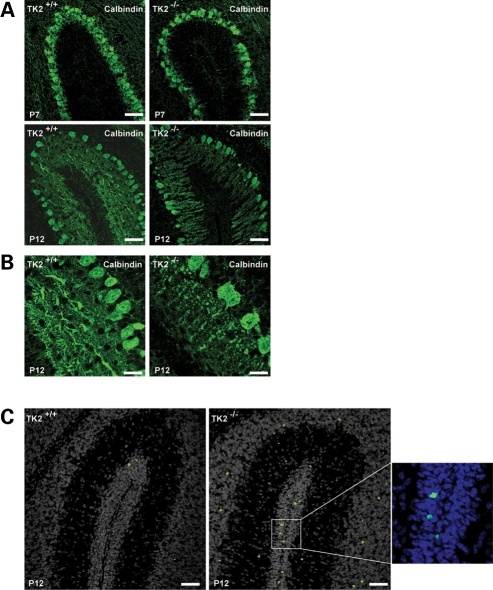
Mutations of thymidine kinase 2 (TK2), an essential component of the mitochondrial nucleotide salvage pathway, can give rise to mitochondrial DNA (mtDNA) depletion syndromes (MDS). These clinically heterogeneous disorders are characterized by severe reduction in mtDNA copy number in affected tissues and are associated with progressive myopathy, hepatopathy and/or encephalopathy, depending in part on the underlying nuclear genetic defect. Mutations of TK2 have previously been associated with an isolated myopathic form of MDS (OMIM 609560). However, more recently, neurological phenotypes have been demonstrated in patients carrying TK2 mutations, thus suggesting that loss of TK2 results in neuronal dysfunction. Here, we directly address the role of TK2 in neuronal homeostasis using a knockout mouse model. We demonstrate that in vivo loss of TK2 activity leads to a severe ataxic phenotype, accompanied by reduced mtDNA copy number and decreased steady-state levels of electron transport chain proteins in the brain. In TK2-deficient cerebellar neurons, these abnormalities are associated with impaired mitochondrial bioenergetic function, aberrant mitochondrial ultrastructure and degeneration of selected neuronal types. Overall, our findings demonstrate that TK2 deficiency leads to neuronal dysfunction in vivo, and have important implications for understanding the mechanisms of neurological impairment in MDS.
Figures
Similar articles
-
Thymidine kinase 2 deficiency-induced mtDNA depletion in mouse liver leads to defect β-oxidation.PLoS One. 2013;8(3):e58843. doi: 10.1371/journal.pone.0058843. Epub 2013 Mar 7. PLoS One. 2013. PMID: 23505564 Free PMC article.
-
Molecular and clinical characterization of the myopathic form of mitochondrial DNA depletion syndrome caused by mutations in the thymidine kinase (TK2) gene.Mol Genet Metab. 2013 Sep-Oct;110(1-2):153-61. doi: 10.1016/j.ymgme.2013.07.009. Epub 2013 Jul 17. Mol Genet Metab. 2013. PMID: 23932787
-
Thymidine kinase 2 (H126N) knockin mice show the essential role of balanced deoxynucleotide pools for mitochondrial DNA maintenance.Hum Mol Genet. 2008 Aug 15;17(16):2433-40. doi: 10.1093/hmg/ddn143. Epub 2008 May 8. Hum Mol Genet. 2008. PMID: 18467430 Free PMC article.
-
Thymidine kinase 2 enzyme kinetics elucidate the mechanism of thymidine-induced mitochondrial DNA depletion.Biochemistry. 2014 Oct 7;53(39):6142-50. doi: 10.1021/bi5006877. Epub 2014 Sep 23. Biochemistry. 2014. PMID: 25215937 Review.
-
Deoxyribonucleoside kinases in mitochondrial DNA depletion.Nucleosides Nucleotides Nucleic Acids. 2004 Oct;23(8-9):1205-15. doi: 10.1081/NCN-200027480. Nucleosides Nucleotides Nucleic Acids. 2004. PMID: 15571232 Review.
Cited by
-
Proteomic Characterization of Synaptosomes from Human Substantia Nigra Indicates Altered Mitochondrial Translation in Parkinson's Disease.Cells. 2020 Dec 2;9(12):2580. doi: 10.3390/cells9122580. Cells. 2020. PMID: 33276480 Free PMC article.
-
Retrospective natural history of thymidine kinase 2 deficiency.J Med Genet. 2018 Aug;55(8):515-521. doi: 10.1136/jmedgenet-2017-105012. Epub 2018 Mar 30. J Med Genet. 2018. PMID: 29602790 Free PMC article.
-
Variation of the 2D Pattern of Brain Proteins in Mice Infected with Taenia crassiceps ORF Strain.Int J Mol Sci. 2024 Jan 25;25(3):1460. doi: 10.3390/ijms25031460. Int J Mol Sci. 2024. PMID: 38338740 Free PMC article.
-
Thymidine kinase 2 deficiency-induced mtDNA depletion in mouse liver leads to defect β-oxidation.PLoS One. 2013;8(3):e58843. doi: 10.1371/journal.pone.0058843. Epub 2013 Mar 7. PLoS One. 2013. PMID: 23505564 Free PMC article.
-
Thymidine Kinase 2 and Mitochondrial Protein COX I in the Cerebellum of Patients with Spinocerebellar Ataxia Type 31 Caused by Penta-nucleotide Repeats (TTCCA)n.Cerebellum. 2023 Feb;22(1):70-84. doi: 10.1007/s12311-021-01364-2. Epub 2022 Jan 27. Cerebellum. 2023. PMID: 35084690 Free PMC article.
References
-
- Alberio S., Mineri R., Tiranti V., Zeviani M. Depletion of mtDNA: syndromes and genes. Mitochondrion. 2007;7:6–12. - PubMed
-
- McFarland R., Taylor R.W., Turnbull D.M. The neurology of mitochondrial DNA disease. Lancet Neurol. 2002;1:343–351. - PubMed
-
- Saada A., Shaag A., Mandel H., Nevo Y., Eriksson S., Elpeleg O. Mutant mitochondrial thymidine kinase in mitochondrial DNA depletion myopathy. Nat. Genet. 2001;29:342–344. - PubMed
-
- Mandel H., Szargel R., Labay V., Elpeleg O., Saada A., Shalata A., Anbinder Y., Berkowitz D., Hartman C., Barak M., et al. The deoxyguanosine kinase gene is mutated in individuals with depleted hepatocerebral mitochondrial DNA. Nat. Genet. 2001;29:337–341. - PubMed
Publication types
MeSH terms
Substances
Grants and funding
LinkOut - more resources
Full Text Sources
Other Literature Sources
Medical
Molecular Biology Databases
Research Materials
Miscellaneous
