. 2010 Apr;30(7):1593-606.
doi: 10.1128/MCB.00038-09. Epub 2010 Feb 1.

Lipid phosphate phosphatase 3 stabilization of beta-catenin induces endothelial cell migration and formation of branching point structures

Affiliations

Lipid phosphate phosphatase 3 stabilization of beta-catenin induces endothelial cell migration and formation of branching point structures

Joseph O Humtsoe et al. Mol Cell Biol. 2010 Apr.

Abstract

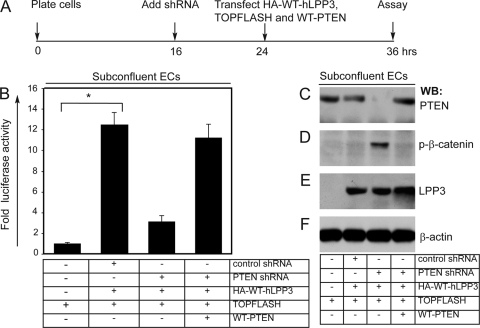
Endothelial cell (EC) migration, cell-cell adhesion, and the formation of branching point structures are considered hallmarks of angiogenesis; however, the underlying mechanisms of these processes are not well understood. Lipid phosphate phosphatase 3 (LPP3) is a recently described p120-catenin-associated integrin ligand localized in adherens junctions (AJs) of ECs. Here, we tested the hypothesis that LPP3 stimulates beta-catenin/lymphoid enhancer binding factor 1 (beta-catenin/LEF-1) to induce EC migration and formation of branching point structures. In subconfluent ECs, LPP3 induced expression of fibronectin via beta-catenin/LEF-1 signaling in a phosphatase and tensin homologue (PTEN)-dependent manner. In confluent ECs, depletion of p120-catenin restored LPP3-mediated beta-catenin/LEF-1 signaling. Depletion of LPP3 resulted in destabilization of beta-catenin, which in turn reduced fibronectin synthesis and deposition, which resulted in inhibition of EC migration. Accordingly, reexpression of beta-catenin but not p120-catenin in LPP3-depleted ECs restored de novo synthesis of fibronectin, which mediated EC migration and formation of branching point structures. In confluent ECs, however, a fraction of p120-catenin associated and colocalized with LPP3 at the plasma membrane, via the C-terminal cytoplasmic domain, thereby limiting the ability of LPP3 to stimulate beta-catenin/LEF-1 signaling. Thus, our study identified a key role for LPP3 in orchestrating PTEN-mediated beta-catenin/LEF-1 signaling in EC migration, cell-cell adhesion, and formation of branching point structures.


Figures

FIG. 1.
FIG. 1.
LPP3 activates β-catenin/LEF-1 signaling and expression of fibronectin through PTEN. (A) pLNCX2 retroviral constructs (constructs a to h). The relative positions of RGD, RGE, RAD, and phosphatase-defective (PD) mutations are shown. Murine Lpp3 (construct d) is the mouse counterpart to human LPP3. Numbers 1 to 6 represent transmembrane segments. The proposed cell binding sequence on the second extracellular loop (II nd extracellular loop) of LPP3 is shown. Three copies of influenza virus-derived hemagglutinin (HA) epitopes (3XHA) were fused N terminally and in frame to the open reading frame of the cDNAs. (B) LEF-1 luciferase activity (mean fold change) in response to expression of the indicated constructs as a function of cell density (50% cell density). (C) Phosphorylation of β-catenin (S33/S37/T41) as measured by WB. p-β-catenin, phosphorylated β-catenin. (D) Equal loading was determined by stripping and reprobing with anti-β-catenin. The position of β-catenin is indicated by a black arrowhead. (E) β-Catenin immunoprecipitates were probed for LEF-1. (F) ELISA of culture medium at (50% cell density) for fibronectin and tissue inhibitor of metalloproteinases 2 (TIMP-2). Experiments were repeated twice, using triplicate wells each time. Data are expressed as means plus SEMs (error bars) (F) or means ± SEMs (error bars) (B). Values that are significantly different are indicated as follows: *, P < 0.05; **, P < 0.01. Constructs a to h are as follows: a, vector; b, human LPP1 (hLPP1); c, hLPP2; d, mouse Lpp3 (mLpp3); e, hLPP3; f, hLPP3-RAD (cell adhesion defective); g, hLPP3-PD (phosphatase defective); h, hLPP3-RAD+PD (double mutant). (G) Anti-FLAG antibody immunoprecipitates prepared from (50% cell density) control ECs (lane 1) or ECs transfected with a FLAG-tagged wild-type (WT) PTEN (lane 2) or FLAG-tagged substrate-trapping PTEN-C124S (phosphatase defective) (lane 3) were analyzed using the indicated antibodies. (H) PTEN stimulates dephosphorylation of β-catenin and increases its stability in subconfluent ECs. ECs at 50% density were transfected with vector alone (control) or PTEN-C124S or increasing concentrations of PTEN-WT (wild-type) cDNA plasmids as indicated. After 24 h, ECs were solubilized, extracted, and centrifuged, and equal amounts of proteins were immunoprecipitated with an anti-β-catenin antibody. All data are representative of at least three separate experiments.
FIG. 2.
FIG. 2.
PTEN knockdown affects LPP3-mediated β-catenin/LEF-1 signaling. (A) Timeline of the experiment, including plating of cells, infection with lentivirus shRNA, transfection of indicated constructs, and LEF-1 (TOPFLASH) assays. Time is shown in hours. (B) Luciferase (LEF-1) assays of control subconfluent ECs, subconfluent ECs infected with control shRNA or PTEN shRNA lentivirus, and ECs expressing indicated constructs. Data are expressed as means plus SEMs (error bars). *, P < 0.05 versus control ECs. (C to F) The extent of PTEN knockdown, transfection of wild-type PTEN (to rule out off-target effects), and hLPP3 protein levels were assayed by Western blotting (WB). Experiments were carried out at least three times in triplicate.
FIG. 3.
FIG. 3.
p120ctn regulates LPP3-mediated β-catenin/LEF-1 signaling. (A) Timeline of the experiment, including plating of cells, infection with lentivirus shRNA, transfection of indicated constructs, and LEF-1 (TOPFLASH) assays. (B) Luciferase (LEF-1) assays of control confluent ECs, confluent ECs infected with control shRNA or p120ctn shRNA lentivirus, and ECs expressing indicated constructs. Data are expressed as means plus SEMs (error bars). *, P < 0.05 versus control ECs. (C to F) The extent of p120ctn knockdown, transfection of p120ctn (to rule out off-target effects), and hLPP3 protein levels were determined by WB. Experiments were carried out at least three times in triplicate. All blots shown are representative of those obtained in at least three separate experiments.
FIG. 4.
FIG. 4.
LPP3 silencing inhibits EC migration and cell-cell adhesion. (A to I) Fluorescence microscopy images of ECs showing the effect of infection with nonsilencing control shRNA (control sh) (A to C) or shLPP3(b) (D to F) or shLPP3(c) (G to I) construct on expression of p120ctn (A, D, and G), fibronectin (B, E, and H), and control protein, CD31 (C, F, and I). The cells were counterstained with DAPI alone (A, D, and G) or tetramethyl rhodamine isothiocyanate (TRITC)-phalloidin and DAPI (B, C, E, F, H, and I). Magnification, ×400. Bars, 200 μm. (J to Q) Cell extracts (total lysates) prepared from ECs infected as described above for panels A to I were analyzed by WB with the indicated antibodies. Black arrowheads indicate nonspecific signals. (R to T) Bright-field images of ECs infected with the indicated constructs. Magnification, ×200. Bar, 100 μm. All data are representative of at least three separate experiments. (U) ECs at 50 to 60% density were infected with nonsilencing control shRNA (control-sh) and shLPP3(c) constructs as described in Materials and Methods. Scratched EC monolayers were incubated in DM containing VEGF. The effect of addition of exogenous fibronectin (Fn) on EC monolayer repair is shown in the rightmost panels. (V) Quantification of chemotactic migration of ECs expressing nonsilencing control-sh and LPP3-silencing shRNAs in the absence and presence of VEGF. Data are expressed as means ± SEMs. *, P < 0.05 versus control-sh by unpaired two-tailed Student's t test.
FIG. 5.
FIG. 5.
Expression of β-catenin restores the effects of loss of LPP3. (A) Quantification of branching point structures was performed as described in Materials and Methods. Data are expressed as means plus SEMs. *, P < 0.05 compared with untransfected ECs. (B to G) Representative images of branching point structures. Black arrows indicate productive branching points, while white arrows indicate unproductive branching points. Results are representative of at least three separate experiments. Magnification, ×200. Bar, 200 μm. (H) Distribution of LPP3 protein in control ECs was analyzed by immunostaining with an anti-LPP3 Ab. (I) Subconfluent ECs were subjected to shRNA-mediated LPP3 knockdown. These cells were then either transfected with HA-tagged p120ctn or HA-tagged β-catenin constructs, and the effects of reexpression were analyzed by immunostaining with anti-HA (red, p120ctn) (J), anti-VE-cadherin (green) (K), anti-HA (red, β-catenin) (L), and p120ctn (green) (M), and nuclear stain DAPI (blue). Magnification, ×400. Bar, 150 μm. (N) Protein complexes were prepared from control ECs, LPP3-knockdown ECs, or LPP3-knockdown ECs transfected with indicated constructs and then analyzed by WB of whole-cell lysates with the indicated Abs. Results are representative of at least three separate experiments.
FIG. 6.
FIG. 6.
Depletion of LPP3 inhibits cell-cell adhesion. (A) Timeline of the experiments, including infection with lentivirus shRNA, transfection of indicated constructs, and cell-cell adhesion assays. (B) ECs (106) were labeled either with DiO (green) and Dil (red) fluorescent chromophores and subjected to cell aggregate (cell swirling) assay at 0 h. The cell aggregates (large and small) were counted at 12 h (n = 3) (*, P < 0.05 versus control ECs). (C) Photomicrograph of a mixture of control ECs labeled with DiO (green) and Dil (red) fluorescent dyes at 0 h. (D) Productive cell aggregates (yellow) are indicated by arrows. (E) Depletion of LPP3 inhibited cell-cell adhesion. (F) Reexpression of p120ctn failed to restore the loss of LPP3. (G) Reexpression of β-catenin restores the loss of LPP3. Magnification for panels C to G, ×200. Bar, 50 μm. The images of cell aggregates (cell-cell adhesion) appear out of focus. (H) Total cell extracts were subjected to Western blot analysis with the indicated antibodies (GAPDH, glyceraldehyde-3-phosphate dehydrogenase). All blots shown are representative of at least three separate experiments.
FIG. 7.
FIG. 7.
Endogenous LPP3 associates with p120ctn. Extracts prepared from ECs grown for 24 (25% density), 48 (50%), 72 (75%), and 96 (100%) h were subjected to immunoprecipitation (IP) and WB with the indicated antibodies (described in Materials and Methods). (A, C, and E) Anti-p120ctn antibody detected two major isoforms of p120ctn polypeptides. (B, D, and F) Anti-LPP3-C-cyto antibody detected a mature, 42-kDa species (immature form, ∼35 kDa). (G and H) Extracts from confluent ECs were immunodepleted with anti-VE-cadherin MAb and immunoprecipitated with the indicated antibodies. Immunoprecipitates were probed with anti-p120ctn MAb (G) or anti-LPP3-C-cyto pAb (H). The positions of molecular mass markers (in kilodaltons) are shown to the left of the gels. The black arrows to the right of the gels in panels B and F point to a nonspecific signal. All blots shown are representative of those obtained in at least three separate experiments. (I and J) Representative confocal microscopic assessment of LPP3 and p120ctn localization. Endothelial cells at 25% (I) and 100% (J) densities were fixed and stained with anti-p120ctn (FITC [green]) MAb, DAPI (blue), and anti-LPP3-RGD (Texas Red) pAbs. At low cell density, endogenous LPP3 (red) was diffusely distributed in the cytosol as well as plasma membrane. Increased colocalization of LPP3 with p120ctn occurred at higher cell densities. Meanwhile, at a low cell density, p120ctn (green) appeared predominantly nuclear (white arrowheads). At a higher cell density, p120ctn appeared in the nucleus, cytosol, and plasma membrane. Arrows indicate colocalization. Images shown are representative of at least three separate experiments. Magnification for panels I and J, ×400. Bar, 150 μm.
FIG. 8.
FIG. 8.
Interaction and colocalization of LPP3 with p120ctn. (A) An illustration of the pLNCX2-driven HA-tagged pLNCX2-LPP3 wild-type retroviral construct. The regions shaded gray and numbered 1 to 6 represent the six transmembrane segments. C-term, C terminus. (B to G) Extracts from confluent HEK293 cells infected with HA-tagged pLNCX2-LPP3 were subjected to IP with the indicated antibodies and analyzed by WB with anti-p120ctn MAb (B), anti-β-catenin MAb (C), anti-γ-catenin MAb (D), and anti-HA pAb (E to G). Anti-HA pAbs detected N-glycosylated species (∼38-kDa and 40- to 42-kDa species; black arrows to the right of the gels) as well as immature LPP3 polypeptides (∼35 kDa; white asterisks on the bands on the gels). All blots shown are representative of at least three separate experiments. (H to J) Immunofluorescence labeling of HEK293 cells for HA (red)(H) and p120ctn (green) (I). Colocalized LPP3 and p120ctn appear yellow (white arrows) (J). Images shown are representative of at least three separate experiments. Magnification for panels H to J, ×200. Bar, 40 μm.
FIG. 9.
FIG. 9.
Interaction of the cytoplasmic domains of LPP3 with p120ctn. (A) Sequences of the N- and C-terminal cytoplasmic (cyto) domains of LPP3. (B) Illustrations of the GST-N-cyto (GST-NC) and GST-C-cyto (GST-CC) fusion proteins. (C) Purity of GST (∼29 kDa), GST-CC (∼32 kDa), and GST-NC (∼31 kDa) was verified by SDS-PAGE and Coomassie blue staining. Faster-migrating species represent GST alone and fusion protein degradation products. (D to I) EC extracts were subjected to IP using the indicated antibodies, and the resulting immunoprecipitates were subjected to far-Western analysis by probing the membranes with GST-LPP3-C-cyto and then anti-GST MAb. Individual lanes from the blot in panel D were excised and probed with anti-VE-cadherin MAb (E), anti-p120ctn MAb (F), anti-β-catenin MAb (G), anti-γ-catenin MAb (H), or anti-β1-integrin pAb (I). (J to M) EC extracts were subjected to GST pulldown with the indicated fusion proteins. Precipitates were analyzed by WB with anti-p120ctn (MAb) (J and K) and anti-GST MAb (L and M). All blots shown are representative of at least three separate experiments.
FIG. 10.
FIG. 10.
The C terminus of LPP3 is required for p120ctn binding and formation of branching point structures. (A) Schematic of LPP3 retroviral constructs pLNCX2-HA-WT-hLPP3 (wild type), pLNCX2-HA-N-Δ-hLPP3 (lacking N-terminal cytoplasmic segment), and pLNCX2-HA-C-Δ-hLPP3 (lacking C-terminal cytoplasmic segment). The second extracellular loop (II nd extracellular loop) and transmembrane segments (segments 1 to 6) are shown. (B and C) ECs expressing pLNCX2-HA-WT-hLPP3(1), pLNCX2-HA-N-Δ-hLPP3(2), and pLNCX2-HA-C-Δ-hLPP3(3) were detached with 3 mM EDTA, washed, and subjected to cell surface biotinylation as described in Materials and Methods. Clarified cell extracts were immunoprecipitated with anti-HA antibody and analyzed by immunoblotting with anti-p120ctn MAb (B) and streptavidin-HRP (C). (D to J) To deplete endogenous LPP3, ECs at 50% density were infected with LPP3sh(c) (L) for 6 h and allowed to recover. After 12 h, ECs were infected with the indicated constructs (constructs 1 to 3) for 6 h, allowed to recover for 4 h, and then subjected to branching point, cell proliferation, and cell migration assays. (D and G to J) Branching point assay in three-dimensional type I collagen matrix. (D) Quantification of branching points. After 24 h, the number of branching points were scored. Data are expressed as percentages of branching points (n = 8). *, P < 0.05 versus L. (G to J) Representative images of branching point formation in response to reexpression of indicated constructs (constructs 1 to 3). Experiments were repeated three times using triplicate wells each time. The black arrows point to branching points. Magnification, ×200. Bar, 200 μm. (E) Percent bromodeoxyuridine (BrdU) incorporation of ECs in response to reexpression of indicated constructs (constructs 1 to 3). The cells were cultured on coverslips coated with 0.2% gelatin for 16 h, fixed, and stained. BrdU-positive cells were enumerated and expressed as percent cell proliferation (n = 8). *, P < 0.05 versus L. (F) Percent cell migration in response to reexpression of the indicated constructs (constructs 1 to 3). P < 0.05 versus L. (K to M) Whole-cell lysates from cells expressing constructs 1 to 3 were subjected to WB analyses with the antibodies indicated. All blots shown are representative of at least three separate experiments.
FIG. 11.
FIG. 11.
A model for LPP3-regulated β-catenin signaling in subconfluent and confluent ECs. In subconfluent ECs, LPP3 protects degradation of β-catenin in a PTEN-dependent manner. This event induces stabilization and translocation of β-catenin to the nucleus, where β-catenin interacts with LEF-1/TCF and displaces transcriptional repressors Groucho/transducin-like Enhancer of split (TLE) to activate transcription of Wnt target genes (e.g., fibronectin). In confluent ECs, excess β-catenin is phosphorylated, and the phosphorylated β-catenin is then subjected to proteosomal degradation. Consequently, p120ctn interacts with LPP3 at the plasma membrane and contributes to EC-EC adhesion and AJ formation, thereby limiting the extent of EC migration.

Similar articles

Cited by

References

    1. Adams, J. C., and F. M. Watt. 1993. Regulation of development and differentiation by the extracellular matrix. Development 117:1183-1198. - PubMed
    1. Bazzoni, G., and E. Dejana. 2004. Endothelial cell-to-cell junctions: molecular organization and role in vascular homeostasis. Physiol. Rev. 84:869-901. - PubMed
    1. Bohnsack, B. L., and K. K. Hirschi. 2004. Red light, green light: signals that control endothelial cell proliferation during embryonic vascular development. Cell Cycle 3:1506-1511. - PubMed
    1. Brindley, D. N., and C. Pilquil. 2009. Lipid phosphate phosphatases and signaling. J. Lipid Res. 50(Suppl.):S225-S230. - PMC - PubMed
    1. Burnett, C., and K. Howard. 2003. Fly and mammalian lipid phosphate phosphatase isoforms differ in activity both in vitro and in vivo. EMBO Rep. 4:793-799. - PMC - PubMed

Publication types

MeSH terms