. 2010 Apr;30(7):1703-17.
doi: 10.1128/MCB.01226-09. Epub 2010 Feb 1.

The motor protein myosin-X transports VE-cadherin along filopodia to allow the formation of early endothelial cell-cell contacts

Affiliations

The motor protein myosin-X transports VE-cadherin along filopodia to allow the formation of early endothelial cell-cell contacts

Sébastien Almagro et al. Mol Cell Biol. 2010 Apr.

Abstract

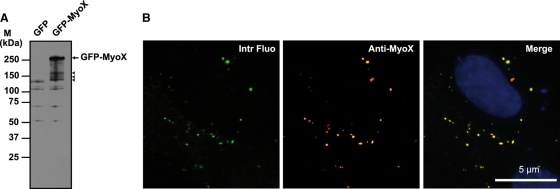
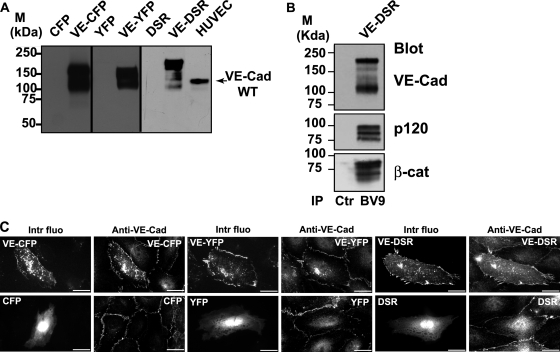
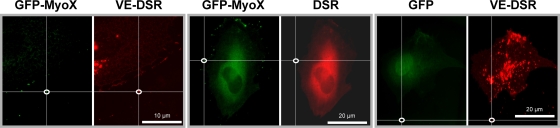
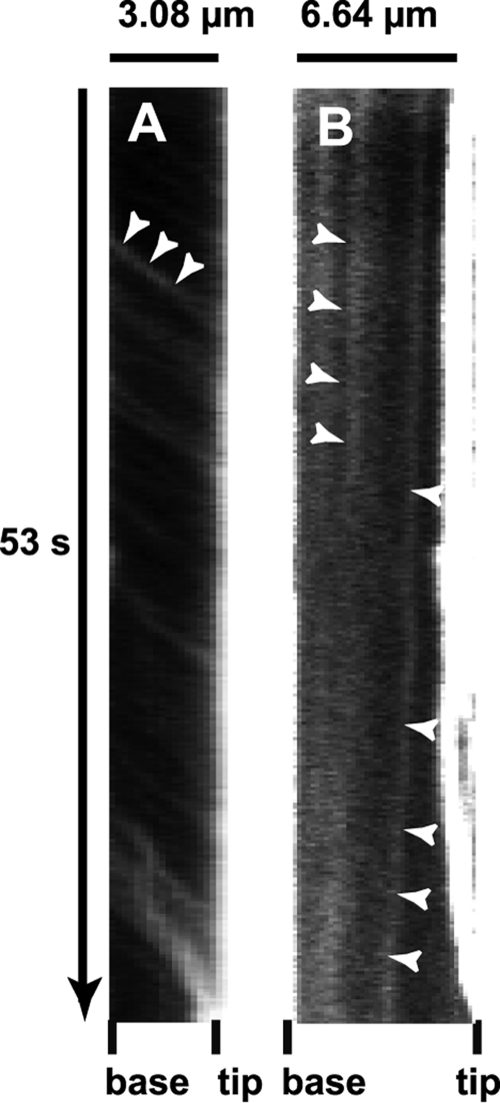
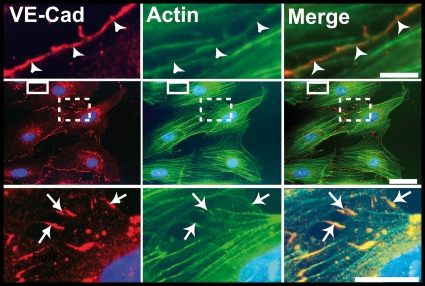
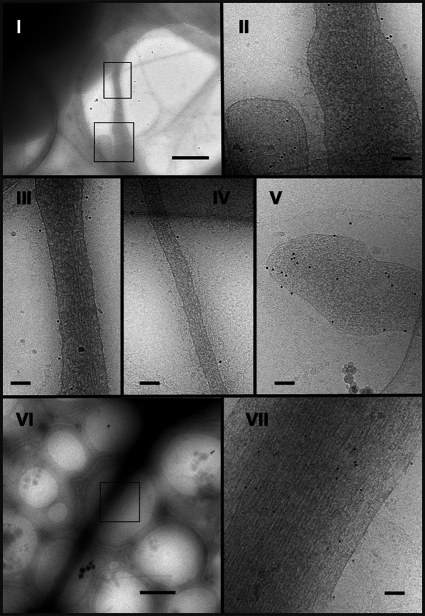
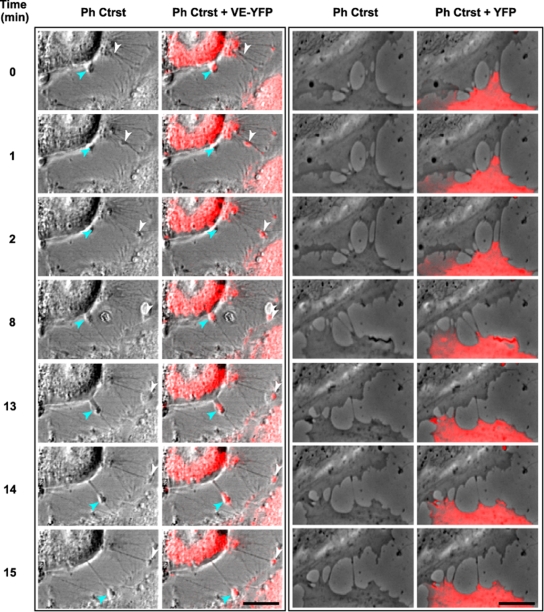
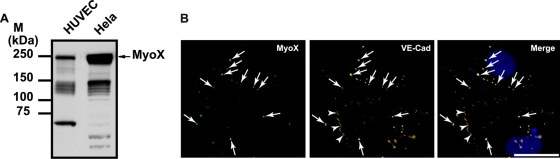
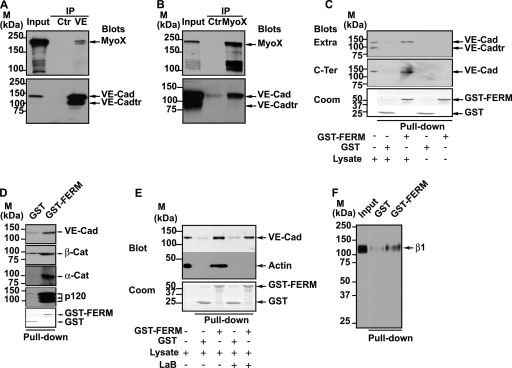
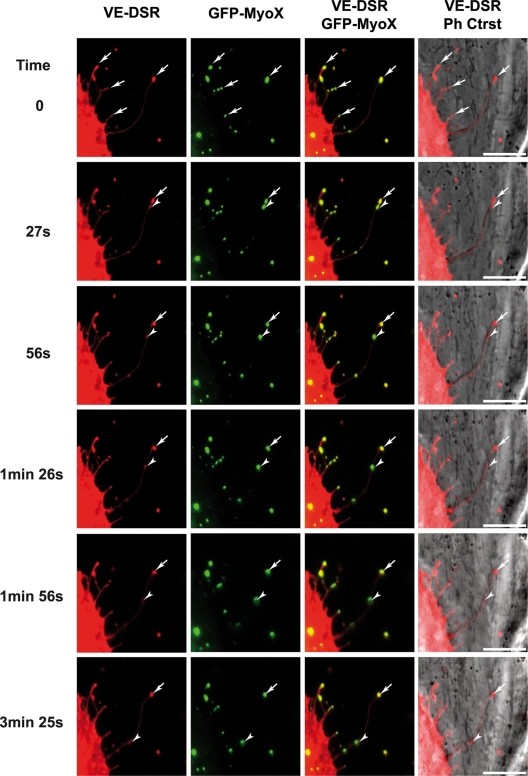
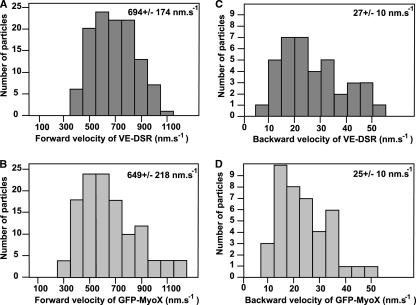
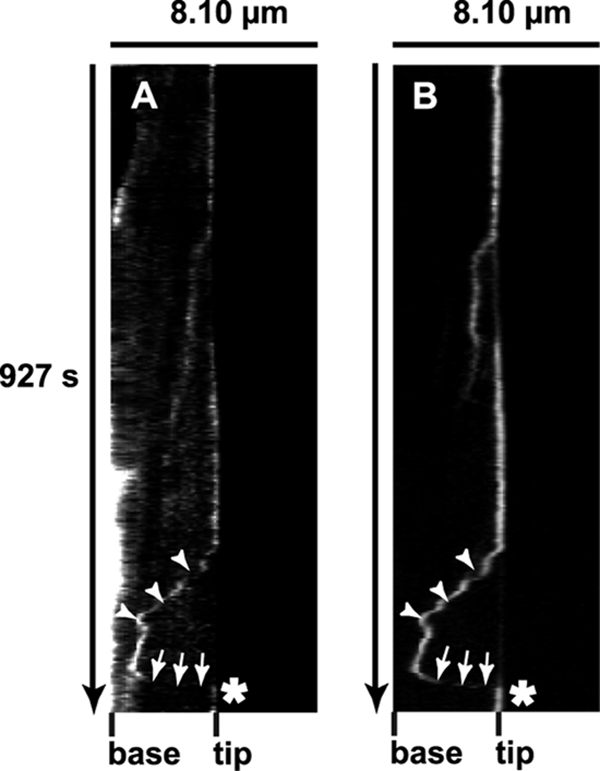
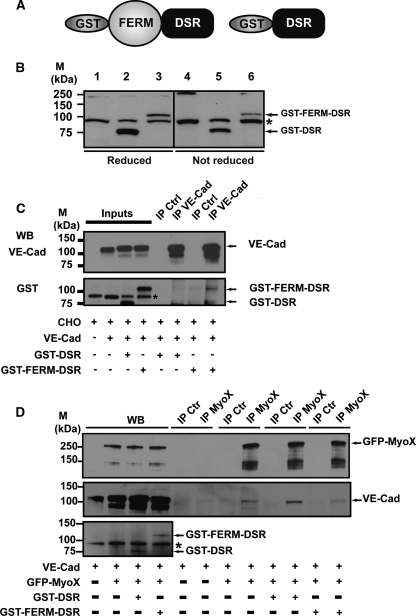
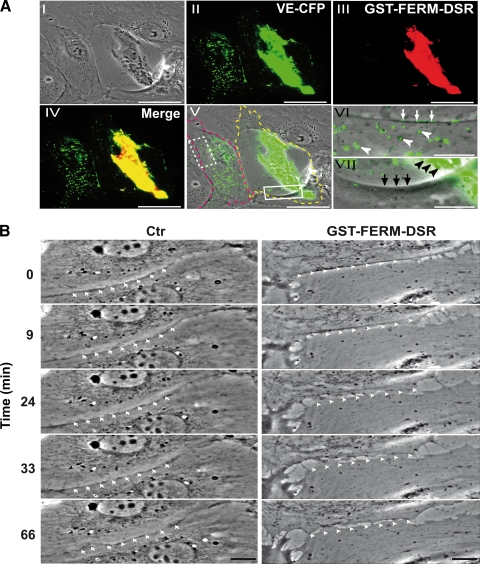
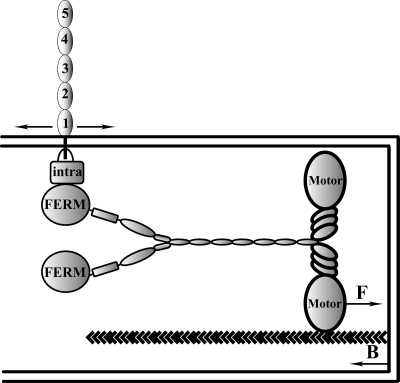
Vascular endothelium (VE), the monolayer of endothelial cells that lines the vascular tree, undergoes damage at the basis of some vascular diseases. Its integrity is maintained by VE-cadherin, an adhesive receptor localized at cell-cell junctions. Here, we show that VE-cadherin is also located at the tip and along filopodia in sparse or subconfluent endothelial cells. We observed that VE-cadherin navigates along intrafilopodial actin filaments. We found that the actin motor protein myosin-X is colocalized and moves synchronously with filopodial VE-cadherin. Immunoprecipitation and pulldown assays confirmed that myosin-X is directly associated with the VE-cadherin complex. Furthermore, expression of a dominant-negative mutant of myosin-X revealed that myosin-X is required for VE-cadherin export to cell edges and filopodia. These features indicate that myosin-X establishes a link between the actin cytoskeleton and VE-cadherin, thereby allowing VE-cadherin transportation along intrafilopodial actin cables. In conclusion, we propose that VE-cadherin trafficking along filopodia using myosin-X motor protein is a prerequisite for cell-cell junction formation. This mechanism may have functional consequences for endothelium repair in pathological settings.


Figures

FIG. 1.
FIG. 1.
Biochemical characterization of the anti-MyoX antibody. (A) The rabbit polyclonal anti-myosin-X antibody identified a polypeptide band of the expected molecular mass in lysates of GFP-MyoX-expressing CHO cells. In contrast, no specific band was detected in lysates of GFP-expressing CHO cells, indicating that no MyoX is expressed in CHO cells. The arrow points out intact GFP-MyoX, whereas arrowheads indicate degradation products. M, molecular mass markers. (B) CHO cells expressing GFP-MyoX were immunofluorescently stained for MyoX. We observed that the intrinsic fluorescence of the GFP tag (Intr Fluo) colocalized with the immunostaining of MyoX (Anti-MyoX), thus attesting to the specificity of the antibody for MyoX.
FIG. 2.
FIG. 2.
Characterization of the fluorescent proteins VE-CFP, VE-YFP, and VE-DSR. (A) Biochemical characterization of VE-CFP, VE-YFP, and VE-DSR. cDNA constructs expressing CFP, VE-CFP, YFP, VE-YFP, DSR, and VE-DSR were transfected in CHO cells. At 24 h posttranfection, lysates of these transfected cells were analyzed by Western blotting. The anti-VE-Cad MAb BV9 identified polypeptide bands of 165, 150, and 190 kDa corresponding to the expected sizes for VE-CFP, VE-YFP and VE-DSR, respectively. These bands were not detected in lysates of CHO cells expressing CFP, YFP, and DSR. In HUVECs used as a control, the wild-type (WT) form of VE-Cad was detected as a 135-kDa polypeptide band. (B) Coimmunoprecipitation of VE-DSR with catenins. Anti-VE-Cad immunoprecipitation (IP BV9) was performed on VE-DSR-expressing CHO cells prior to being resolved on a 4 to 12% gradient gel, electrotransferred, and probed successively for VE-Cad, p120, and β-catenin (β-cat). As control, an immunoprecipitation performed on VE-DSR-expressing CHO cells using rabbit nonimmune IgG (Ctr) was analyzed in parallel. Molecular mass markers (M) are given at the margin of the panel. (C) Localization at cell-cell contacts of exogenous VE-CFP, VE-YFP, and VE-DSR transiently expressed in HUVECs. HUVECs expressing VE-CFP, CFP, VE-YFP, YFP, VE-DSR, and DSR were immunofluorescently stained for VE-Cad and observed by confocal microscopy. Then, the intrinsic fluorescence of the CFP, YFP, and DSR tags (Intr fluo) was compared to the immunofluorescent staining (Anti-VE-Cad). As expected, the three fluorescent VE-Cad proteins were mainly expressed at cell-cell junctions and on filopodia recapitulating the staining pattern of endogenous VE-Cad. In contrast, the proteins CFP, YFP, and DSR did not present a specific localization. Bars, 20 μm.
FIG. 3.
FIG. 3.
Specificity of localization of VE-DSR and GFP-MyoX in double-fluorescently transfected HUVECs. To control the specificity of GFP-MyoX localization, HUVECs coexpressing either GFP-MyoX and VE-DSR (panels at left) or GFP-MyoX and DSR (middle panels) were analyzed in green and red fluorescence channels. Using ImageJ, the fluorescent intensities (I) of GFP-MyoX spots (delimited by ellipses) were measured and compared to the fluorescent intensities of the superimposed areas in the other channel. While the mean value for the IGFP-MyoX/IVE-DSR ratio ranges around 1 (20 measurements from 5 images), that of the IGFP-MyoX/IDSR ratio varied between 3 × 10⁵ and infinite (20 measurements from 5 images). Similarly, to control the specificity of VE-DSR localization, HUVECs coexpressing GFP and VE-DSR were analyzed in parallel for fluorescent localization (panels at right). While the mean value for the IVE-DSR/IGFP-MyoX ratio ranges around 1, that of the IVE-DSR/IGFP ratio varied between 1 × 10⁵ and infinite (20 measurements from 5 images). From ratio-metric quantification, it can be deduced that the localization of VE-DSR or GFP-MyoX is not disturbed by GFP- and DSR-associated fluorescence, respectively.
FIG. 4.
FIG. 4.
Kymographs illustrating the forward and backward movements of GFP-MyoX. (A) Kymograph of a selected filopodium emanating from GFP-MyoX-expressing HeLa cells imaged at 25°C using a ×40 lens (NA 1.35), a pixel size of 162 nm, and a frame rate of 5.6 images s−1 over 300 frames. Numerous faint tracks sloped down toward the filopodium tip, illustrating the forward movement of GFP-MyoX. Note that patches of GFP-MyoX move at a relatively similar constant velocity. (B) Kymograph of a selected filopodium emanating from a GFP-MyoX-expressing HeLa cell imaged as in Fig. 4A. Two faint tracks sloped down toward the filopodium base, illustrating the backward movement of MyoX.
FIG. 5.
FIG. 5.
Localization of VE-Cad in subconfluent HUVECs. Images in the central row show a HUVEC monolayer immunolabeled for VE-Cad (red, left) and actin (green, center), as well as the merge (right). The selected enlargements of a mature cell-cell junction (continuous frame) and an immature junction (dotted frame) are shown in the upper and lower rows, respectively. In mature junctions, VE-Cad and cortical actin fibers are located at the cell circumference (arrowheads, upper row). In contrast, in immature junctions, VE-Cad colocalizes with radial actin fibers along filopodial extensions bridging adjacent cells (arrows, lower row). Bars: 2 μm, upper; 10 μm, middle; and 5 μm, lower.
FIG. 6.
FIG. 6.
Localization of VE-Cad at the surface of HUVEC filopodia by electron microscopy. Living HUVECs were seeded on electron microscopy holey grids and grown for 24 h. After fixation without permeabilization, cells were successively marked with MAb BV9 antibody and protein A-conjugated gold particles to reveal the presence of VE-Cad at the cell surface. They were then vitrified for observation. Electron micrographs revealed filopodia of various diameters and lengths connecting adjacent cells (micrographs I and VI, bars, 1 μm). Higher-magnification images show gold particles dispersed along the length (micrographs II, III, IV, and VII, bars, 100 nm) and at the tip of filopodia (micrograph V, bar, 100 nm). This indicates that VE-Cad is distributed over the surface of filopodia. Furthermore, on large as well as thin filopodia, underneath the plasma membrane, the network of actin fibers could be observed parallel to the filopodium axis (micrograph VII).
FIG. 7.
FIG. 7.
Selected sequences showing VE-YFP moving along filopodia. Subconfluent HUVECs were transiently transfected with the plasmids expressing either VE-YFP or YFP. At 17 h posttransfection time, confocal video microscopy images were taken every min for 1 h both in phase-contrast (Ph Ctrst) to see the filopodia and in the yellow fluorescence channel. Panels corresponding to VE-YFP-expressing HUVECs (left) showed two distinct patches, indicated by arrowheads, moving sequentially along two filopodia (see Movie S1 in the supplemental material). In contrast, no YFP was detected along filopodia, as illustrated in panels corresponding to YFP-expressing HUVECs (right) (see Movie S2 in the supplemental material). Bars, 10 μm.
FIG. 8.
FIG. 8.
Expression of MyoX in HUVECs and HeLa cells. (A) Detection of endogeneous MyoX by Western blotting. HUVEC and HeLa cell lysates were analyzed by Western blotting using the anti-MyoX pAb antibody. In HUVECs as well in HeLa cells, the antibody detected a 240-kDa band corresponding to the expected size of MyoX and several bands of lower molecular mass corresponding to MyoX degradation (6). Larger amounts of MyoX were detected in HeLa cells compared to HUVECs. (B) Partial colocalization of endogenous MyoX and VE-Cad along filopodia in subconfluent HUVECs. Subconfluent HUVECs were double labeled for MyoX (left) and VE-Cad (center) with anti-MyoX pAb, anti-VE-Cad MAb BV9, and Alexa 555-labeled goat anti-rabbit and Alexa 488-labeled goat anti-mouse antibodies and Hoechst stain. The merged image is at the right. Arrows point out VE-Cad patches colocalized with MyoX, while arrowheads indicate cell-cell junctions where VE-Cad and MyoX did not colocalize. Bar, 20 μm.
FIG. 9.
FIG. 9.
Association of MyoX to the VE-Cad-based complex. (A and B) Coimmunoprecipitations of endogenous MyoX with endogenous VE-Cad in HUVECs. Anti-VE-Cad (IP VE; A) and anti-MyoX (IP MyoX; B) immunoprecipitations were resolved on 4 to 12% gradient gels, electrotransferred and probed successively for VE-Cad and MyoX. As controls, an aliquot of whole-cell lysate (input) and immunoprecipitations performed on HUVEC lysates using rabbit nonimmune IgG (Ctr) were analyzed in parallel. Note that anti-VE-Cad IP (A) and input analysis by Western blotting (B) revealed the presence of a 100-kDa truncated form of VE-Cad (VE-Cadtr). Molecular mass markers (M) are given at the margins of each panel. (C) Interaction of MyoX with the VE-Cad complex through its FERM domain. GST or GST-FERM immobilized on glutathione beads was incubated with either HUVEC lysates or with buffer. Pulldown assays were revealed with the anti-VE-Cad antibodies directed against the extracellular domain (Extra; MAb BV9) or the cytoplasmic domain (C-Ter, pAb C-19). (Lower panel) Coomassie (Coom) staining of GST proteins used in each pulldown assay. For comparison, aliquots of whole-cell lysates and pulldown assay controls performed without lysate were analyzed in parallel. Note that the antibody C-19 raised against the 19-amino-acid C-terminal peptide of VE-Cad did not recognize VE-Cadtr, indicating that the truncated form of VE-Cad is cleaved at its C terminus. Only the uncleaved form of VE-Cad is coprecipitated with the FERM domain of MyoX. (D) Coprecipitation of catenins with VE-Cad by the FERM domain of MyoX. GST and GST-FERM pulldown assays performed on HUVEC lysates were probed with VE-Cad, α-catenin (α-cat), β-catenin (β-cat), and p120 antibodies. All of these proteins were detected in pulldown assays performed with GST-FERM but not with GST alone. (E) The interaction between the VE-Cad complex and MyoX does not require actin fibers. GST and GST-FERM pulldown assays performed on HUVEC lysates treated (+) or not (−) with latrunculin B (LaB) were sequentially immunoblotted for VE-Cad with C-19 pAb and for β-actin with anti-β-actin MAb. For comparison, an aliquot of whole-cell lysate was analyzed in parallel. (Lower panel) Coomassie staining of GST proteins. In pulldown assays, VE-Cad was precipitated with the domain FERM of MyoX, even in the absence of actin. (F) The recombinant GST-FERM protein interacts with the β1 chain of integrins. GST and GST-FERM pulldown assays performed on HUVEC lysates were immunoblotted for the β1 chain of integrins with the pAb anti-β1 integrin antibody. For comparison, an aliquot of whole-cell lysate (input) was analyzed in parallel. In pulldown assays, the β1 chain of integrins was precipitated with the domain FERM of MyoX.
FIG. 10.
FIG. 10.
Selected sequence focusing on the coordinated backward movements of MyoX and VE-Cad. Subconfluent HUVECs, transiently cotransfected with plasmids expressing GFP-MyoX and VE-DSR, were observed by video microscopy at 17 h posttransfection at a frame rate of 1 image/3 s. Full arrowheads and arrows indicate moving and immobile patches, respectively, for VE-Cad and MyoX. Bars, 10 μm.
FIG. 11.
FIG. 11.
Velocity histograms for forward and backward movements of VE-DSR and GFP-MyoX patches. Histograms corresponding to the forward movements of VE-DSR (A) and GFP-MyoX (B) patches were generated from 115 and 129 measurements, respectively, while those corresponding to the backward movements of VE-DSR (C) and GFP-MyoX (D) patches were generated from 38 and 41 measurements, respectively. At the top right, the means ± standard deviations are indicated. HeLa cells were imaged at 25°C using a ×40 lens (NA, 1.35), a pixel size of 162 nm, and a frame rate ranging from 3 to 5 images s−1.
FIG. 12.
FIG. 12.
MyoX and VE-Cad dynamics in living HeLa cells. Shown are synchronous kymographs of a selected filopodium emanating from HeLa cells coexpressing VE-DSR (A) and GFP-MyoX (B) imaged at 25°C using a ×40 lens (NA, 1.35), a pixel size of 162 nm, and a frame rate of 3 images/10 s. The VE-DSR kymograph showed a patch that (i) remained stationary (vertical track), (ii) globally moved backward toward the filopodium base (arrowheads), (iii) abruptly changed direction, and (iv) moved forward (arrows) prior to reaching the filopodium tip. Note that the backward phase was frequently interrupted by pausing events, thus creating a stair-shaped track (arrowheads). This track was perfectly detected in the corresponding GFP-MyoX kymograph illustrating the synchronous movement of VE-DSR and GFP-MyoX patches on a given filopodium.
FIG. 13.
FIG. 13.
Biochemical characterization of the recombinant proteins GST-FERM-DSR and GST-DSR. (A) Schematic representation of MyoX and its derived fragments. The recombinant fragment GST-FERM-DSR was designated to keep the capacity of MyoX to interact with VE-Cad via its FERM domain. The GST-DSR recombinant fragment was used as a control. (B) Expression of GST-DSR and GST-FERM-DSR. CHO cells were transfected with either GST-DSR (lanes 2 and 5) or GST-FERM-DSR (lanes 3 and 6) or not (lanes 1 and 4). Expression of GST-DSR and GST-FERM-DSR in CHO cells was verified by Western blotting (WB) using the anti-GST antibody. This antibody recognized an 80-kDa band and a 110-kDa band corresponding to GST-DSR and GST-FERM-DSR, respectively. Additionally, it also unspecifically recognized a protein present in CHO lysates (asterisk). (C) GST-FERM-DSR interacts with VE-cadherin. Anti-VE-Cad immunoprecipitations (IP VE-Cad) were performed on CHO cell lysates coexpressing either VE-Cad and GST-FERM-DSR or VE-Cad and GST-DSR using the Mab anti-VE-Cad BV9. As controls, aliquots of whole CHO lysates (inputs) and immunoprecipitations performd on CHO lysates using mouse nonimmune IgG (IP Ctrl) were analyzed in parallel. A 110-kDa band corresponding to GST-FERM-DSR was detected in the anti-VE-Cad immunoprecipitate, indicating that GST-FERM-DSR is able to interact with VE-Cad. The anti-GST antibody recognized, as in panel B, GST-DSR and GST-FERM-DSR, as well as an unspecific protein present in CHO cell lysates (asterisk). (D) Celluar VE-Cad sequestration by the MyoX FERM domain. VE-Cad-expressing CHO cells (40) were transiently transfected with plasmids coding for GFP-MyoX and either GST-DSR or GST-FERM-DSR. After cell lysis, anti-MyoX immunoprecipitations were resolved on 4 to 12% gradient gels, electrotransferred, and probed successively for VE-Cad, MyoX, and GST. As controls, aliquots of the various CHO lysates and immunoprecipitations performed using rabbit nonimmune IgG (IP Ctr) were analyzed in parallel. Molecular markers (M) are given at the left (B to D).
FIG. 14.
FIG. 14.
Functional role of MyoX-mediated transport of VE-Cad. (A) Blockage of VE-CFP transport by GST-FERM-DSR expression. Subconfluent HUVECs transiently cotransfected with plasmids expressing VE-CFP and GST-FERM-DSR were observed 20 h posttransfection in phase-contrast (I) and in the cyan and red fluorescence channels. VE-CFP (II; green), GST-FERM-DSR (III; red), VE-CFP and GST-FERM-DSR merging (IV), and VE-CFP and phase-contrast merging (V, VI, and VII) allowed the visualization of two adjacent differentially-transfected cells: the cell at the right (delimited by the yellow dotted line) coexpressed GST-FERM-DSR and VE-CFP, while the cell at the left (delimited by pink dotted line) only expressed VE-CFP. Other cells of the fields are untransfected. The selected enlargements show that VE-CFP patches are at the cell-cell junctions (white arrows) and dispersed at the cell surface (white arrowheads) in the monotransfected cell (VI; dotted rectangle in V), whereas in the double-transfected cell, VE-CFP and GST-FERM-DSR colocalized and gathered around the cell nucleus (black arrowheads, VII; rectangle, V), indicating that GST-FERM-DSR blocked the VE-Cad transport to the cell edge. In control experiments, in cells coexpressing GST-DSR and VE-CFP, VE-CFP patches are located at cell-cell junctions (data not shown). Bars, 40 μm (I to V) and 10 μm (VI and VII). (B) Blockage of intercellular contact formation by GST-FERM-DSR expression. The sequences are selected from Movie S9 in the supplemental material and focus on the edges of two adjacent cells. In the right column, the cell below expressed GST-FERM-DSR, while the cell at the top is untransfected. In the left column, both cells expressed GST-DSR. Arrowheads show unstable junctions, whereas arrows point out stable junctions. Bars, 10 μm.
FIG. 15.
FIG. 15.
Schematic model illustrating the movements of VE-Cad along filopodia (43). MyoX binds to actin filaments via its motor domain and to the VE-Cad-catenin complex (intra) via its FERM domain. Consequently, VE-Cad moves forward (F) toward the filopodium tip at a rate ranging around 700 nm s−1 and backwards (B) at a rate ranging around 30 nm s−1.

Similar articles

Cited by

References

    1. Aberle, H., A. Bauer, J. Stappert, A. Kispert, and R. Kemler. 1997. Beta-catenin is a target for the ubiquitin-proteasome pathway. EMBO J. 16:3797-3804. - PMC - PubMed
    1. Adams, C. L., Y. T. Chen, S. J. Smith, and W. J. Nelson. 1998. Mechanisms of epithelial cell-cell adhesion and cell compaction revealed by high-resolution tracking of E-cadherin-green fluorescent protein. J. Cell Biol. 142:1105-1119. - PMC - PubMed
    1. Adams, C. L., W. J. Nelson, and S. J. Smith. 1996. Quantitative analysis of cadherin-catenin-actin reorganization during development of cell-cell adhesion. J. Cell Biol. 135:1899-1911. - PMC - PubMed
    1. Bear, J. E., and F. B. Gertler. 2009. Ena/VASP: towards resolving a pointed controversy at the barbed end. J. Cell Sci. 122:1947-1953. - PMC - PubMed
    1. Berg, J. S., and R. E. Cheney. 2002. Myosin-X is an unconventional myosin that undergoes intrafilopodial motility. Nat. Cell Biol. 4:246-250. - PubMed

Publication types

MeSH terms