. 2010 Apr 2;285(14):10616-26.
doi: 10.1074/jbc.M109.069070. Epub 2010 Feb 1.

Conformation change in a self-recognizing autotransporter modulates bacterial cell-cell interaction

Affiliations

Conformation change in a self-recognizing autotransporter modulates bacterial cell-cell interaction

Victoria Girard et al. J Biol Chem. .

Abstract

Bacteria mostly live as multicellular communities, although they are unicellular organisms, yet the mechanisms that tie individual bacteria together are often poorly understood. The adhesin involved in diffuse adherence (AIDA-I) is an adhesin of diarrheagenic Escherichia coli strains. AIDA-I also mediates bacterial auto-aggregation and biofilm formation and thus could be important for the organization of communities of pathogens. Using purified protein and whole bacteria, we provide direct evidence that AIDA-I promotes auto-aggregation by interacting with itself. Using various biophysical and biochemical techniques, we observed a conformational change in the protein during AIDA-AIDA interactions, strengthening the notion that this is a highly specific interaction. The self-association of AIDA-I is of high affinity but can be modulated by sodium chloride. We observe that a bile salt, sodium deoxycholate, also prevents AIDA-I oligomerization and bacterial auto-aggregation. Thus, we propose that AIDA-I, and most likely other similar autotransporters such as antigen 43 (Ag43) and TibA, organize bacterial communities of pathogens through a self-recognition mechanism that is sensitive to the environment. This could permit bacteria to switch between multicellular and unicellular lifestyles to complete their infection.


Figures

FIGURE 1.
FIGURE 1.
Auto-aggregation of bacterial cells expressing AIDA-I. A, schematic representation of AIDA-I and the location of an auto-aggregation defective mutant, I24. The white box represents the signal sequence, the light gray boxes represent the imperfect 19-amino acids repeats, and the dark box represents the membrane-embedded fragment, AIDAc. B and C, auto-aggregation in mixes of bacteria expressing AIDA-I or I24. Overnight cultures of bacteria expressing wild-type AIDA-I (WT) or the I24 mutant were left standing in culture tubes for 180 min. The cultures have resistance against ampicillin (AmpiR) or against ampicillin and chloramphenicol (AmpiR/CmlR), respectively. In B, the OD600 nm values at the top of the cultures were compared with the values at the beginning of the assay. The columns were compared with the WT control by performing a one-way ANOVA and Dunnett's post tests. *, statistical significance (p < 0.05); NS, not significant. In C, the colony forming units (cfu) of bacteria bearing the different combinations of markers were evaluated, and a ratio was calculated. The ratios were compared by a Student's t test and were found to be statistically different. *, p < 0.05. The assays were performed three times in duplicate.
FIGURE 2.
FIGURE 2.
Inhibition of auto-aggregation by purified AIDA-I and not by cellular extracts. A, cultures bearing an empty vector (-) or expressing AIDA-I (WT) were incubated in deep well 96-wells plates with or without total lysates (L) or membrane extracts (M) prepared from cultures harboring the empty vector or expressing AIDA-I and left standing for 90 min. The columns were compared with the wild-type control by performing a one-way ANOVA and Dunnett's post tests. *, statistical significance (p < 0.05); NS, not significant. B, auto-aggregation assays of cultures of bacteria expressing AIDA-I were performed with various concentrations of purified AIDA-I present. The points were fitted by nonlinear regression to a sigmoidal dose-response. C, normalized cultures of bacteria harboring an empty vector or expressing AIDA-I were incubated with or without 200 nm wild-type protein, mutated protein I24, or heat-extracted purified protein (HE). The columns were compared with the wild-type vector control by performing a one-way ANOVA and Dunnett's post tests. *, statistical significance (p < 0.05); NS, not significant.
FIGURE 3.
FIGURE 3.
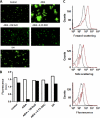
Auto-aggregation of fluorescent beads mediated by purified AIDA-I. A, solutions containing empty fluorescent polystyrene beads (Control), AIDA-coupled beads (AIDA), and I24-coupled beads (I24) were left standing overnight, and the samples were taken at the bottom of the tube and examined by fluorescent microscopy. The experiments were performed with AIDA-coupled beads in the presence of 1 m NaCl or 0.1% sodium deoxycholate (DOC). B, samples were taken on top of the solutions containing the beads at the beginning of the assay (white bars) and after overnight incubation (black bars), and fluorescence at 515 nm was measured. C, the solutions containing empty beads (black) or AIDA-coupled beads (red) solutions were left standing at room temperature for 6 h and then analyzed by flow cytometry. All of the experiments were repeated three times; typical results are shown.
FIGURE 4.
FIGURE 4.
In vitro evidence of AIDA-AIDA interactions. A, representative SPR for kinetic titrations of soluble AIDA-I (0–1000 nm) binding to 6,700 RU amine-coupled AIDA-I at 30 μl/min. The dashed line indicates 200 nm injection of heat-treated AIDA-I (60 °C for 20 min). B, representative SPR for equilibrium titrations of soluble AIDA-I (0–1000 nm) binding to immobilized AIDA-I at 10 μl/min. The symbols represent RU at equilibrium (Req), and the lines represent nonlinear regression analysis. The average of three independent trials yielded apparent KD constants of 36 nm (top curve, 6700 RU AIDA-I), 59 nm (middle curve, 2500 RU AIDA-I), and 52 nm (bottom curve, 1000 RU AIDA-I).
FIGURE 5.
FIGURE 5.
Chemical cross-linking of AIDA-I. A, cultures of bacteria expressing wild-type AIDA-I (WT) or the I24 mutant were incubated with or without 300 μm BS3 cross-linker for 30 min. The samples were diluted in 2× SDS-PAGE loading buffer and immunoblotted with an antibody directed against the extracellular part of AIDA-I. B, purified proteins (0.2 mg/ml in 1 mm Tris, pH 8, 150 mm NaCl) were cross-linked in the same conditions, and the samples were treated by SDS-PAGE and immunoblotting similarly. pro., pro-protein; mat., mature extracellular AIDA-I.
FIGURE 6.
FIGURE 6.
Modulation of AIDA-AIDA interaction and bacterial auto-aggregation. A, kinetic SPR analysis in which purified AIDA-I (150 nm) was injected in the presence of increasing NaCl concentration. The experiments were performed three times. The average responses observed were normalized to the response observed at 150 mm NaCl. The columns were compared by performing a one-way ANOVA and Dunnett's post tests. *, statistical significance (p < 0.05). B, overnight cultures of bacteria expressing AIDA-I (WT) or harboring an empty vector were resuspended in 50 mm Tris-HCl pH 8 buffers at different ionic strengths and were left standing at 4 °C. The OD600 nm at the top of the culture was measured at the end of the assay after 180 min and compared with the value at the beginning of the assay. The assays were performed three times in duplicate, and the columns were compared by a two-way ANOVA and Bonferroni post-tests. *, statistical significance (p < 0.05); NS, not significant.
FIGURE 7.
FIGURE 7.
Conformation change in AIDA-I. A, far-UV CD spectra of purified wild-type AIDA-I when sodium chloride was added to the buffer to yield a final concentration of 150, 330, 660, or 1000 mm. The signal was converted to mean residual ellipticity (MRE). B, intrinsic fluorescence of purified AIDA-I after excitation at 290 nm was recorded in the same buffers and reported in arbitrary units (a.u.). C and D, far-UV CD spectra (C) and intrinsic fluorescence (D) of the purified I24 mutant were obtained as in A and B, in the presence of 150 mm or 1 m NaCl.
FIGURE 8.
FIGURE 8.
Effect of bile salt on AIDA-AIDA interaction and auto-aggregation. A, overnight cultures of bacteria expressing AIDA-I (WT) or harboring an empty vector were resuspended in TBS with or without 0.1% sodium deoxycholate and were left standing at 4 °C. The OD600 nm at the top of the culture was measured at the end of the assay after 180 min and compared with the value at the beginning of the assay. The assays were performed three times in duplicate, and columns were compared by a two-way ANOVA and Bonferroni post-tests. *, statistical significance (p < 0.05); NS, not significant. B, far-UV CD spectrum of purified AIDA-I was recorded in TBS without (solid line) or with (dashed line) 0.1% sodium deoxycholate (DOC).

Similar articles

Cited by

References

    1. Nataro J. P., Deng Y., Maneval D. R., German A. L., Martin W. C., Levine M. M. (1992) Infect. Immun. 60, 2297–2304 - PMC - PubMed
    1. Menozzi F. D., Boucher P. E., Riveau G., Gantiez C., Locht C. (1994) Infect. Immun. 62, 4261–4269 - PMC - PubMed
    1. McDevitt D., Francois P., Vaudaux P., Foster T. J. (1994) Mol. Microbiol. 11, 237–248 - PubMed
    1. Frick I. M., Mörgelin M., Björck L. (2000) Mol. Microbiol. 37, 1232–1247 - PubMed
    1. Berge A., Kihlberg B. M., Sjöholm A. G., Björck L. (1997) J. Biol. Chem. 272, 20774–20781 - PubMed

Publication types

MeSH terms

LinkOut - more resources