. 2010 Feb 8;188(3):429-41.
doi: 10.1083/jcb.200906043. Epub 2010 Feb 1.

Autonomous right-screw rotation of growth cone filopodia drives neurite turning

Affiliations

Autonomous right-screw rotation of growth cone filopodia drives neurite turning

Atsushi Tamada et al. J Cell Biol. .

Abstract

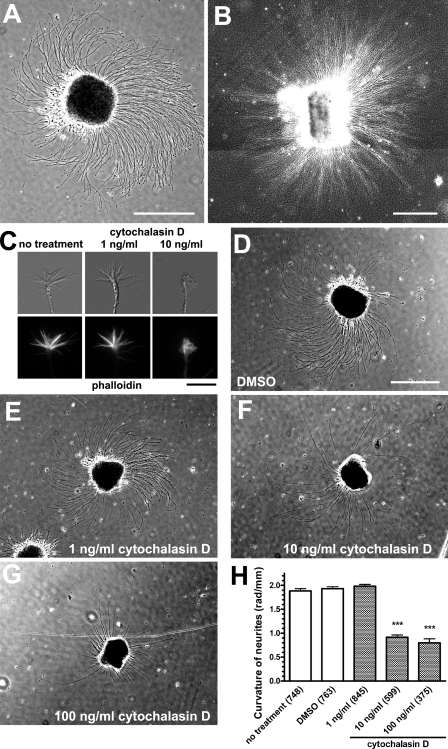
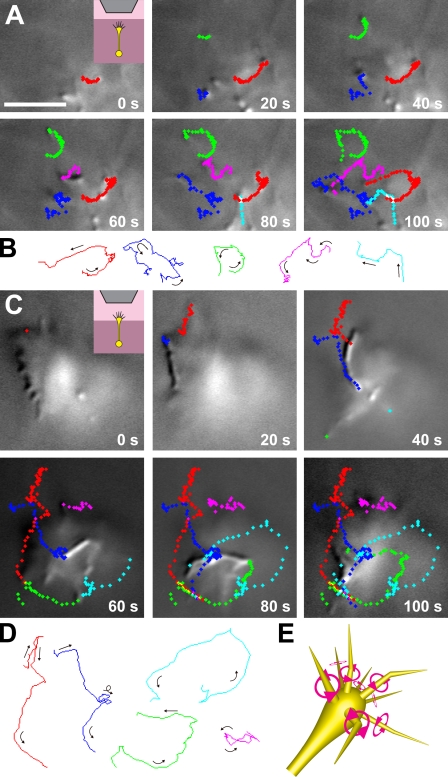
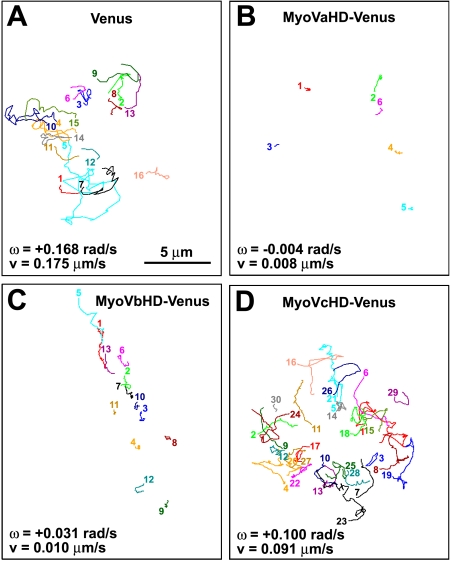
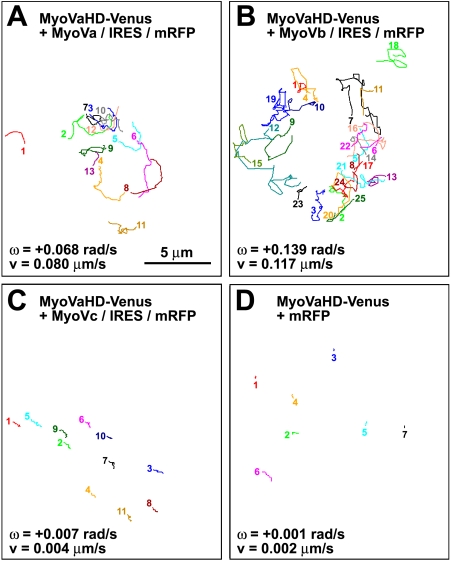
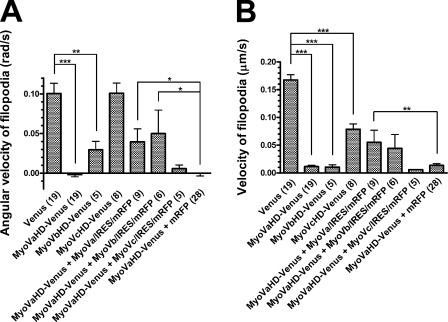
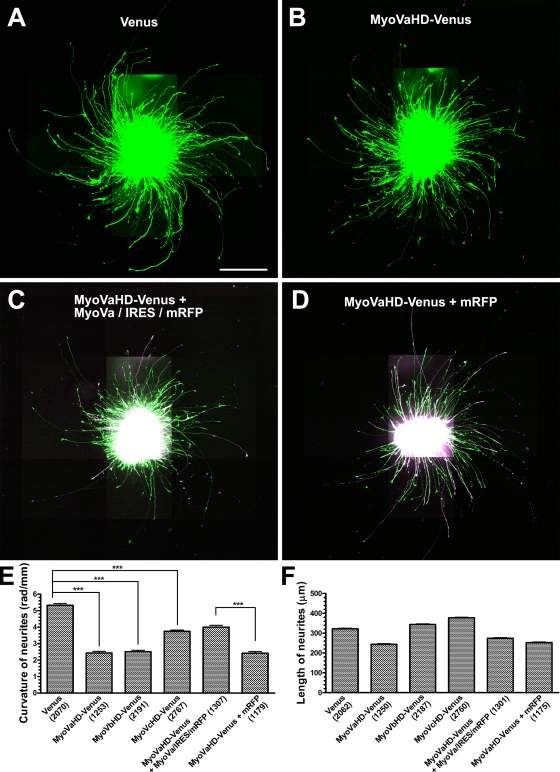
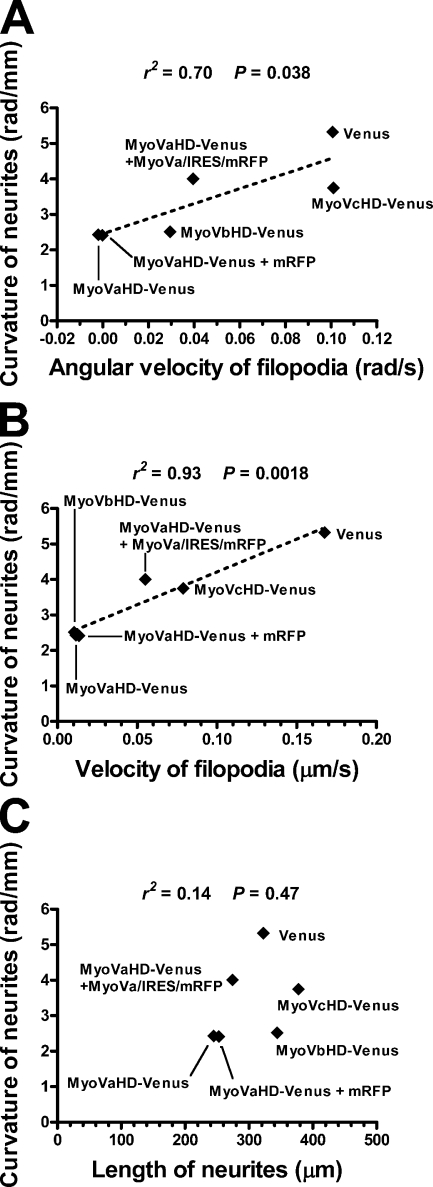
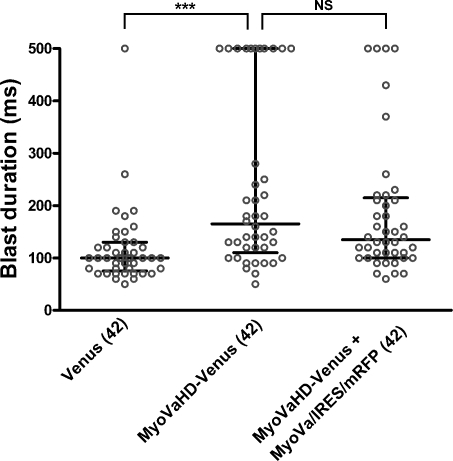
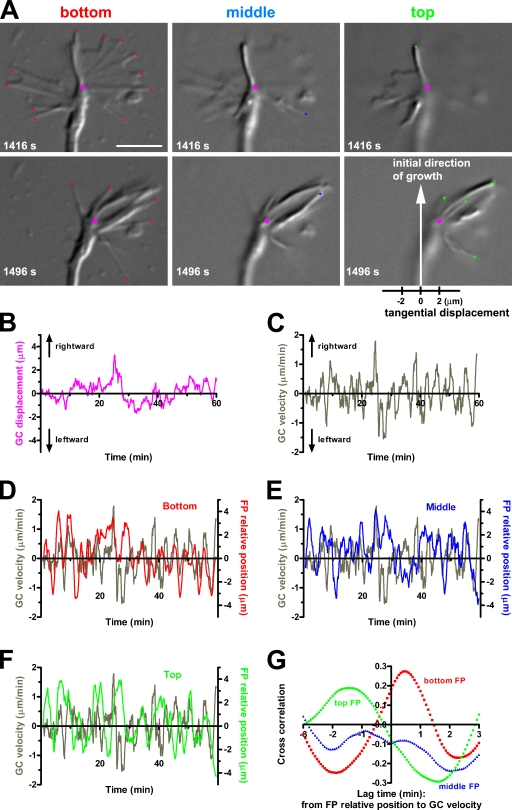
The direction of neurite elongation is controlled by various environmental cues. However, it has been reported that even in the absence of any extrinsic directional signals, neurites turn clockwise on two-dimensional substrates. In this study, we have discovered autonomous rotational motility of the growth cone, which provides a cellular basis for inherent neurite turning. We have developed a technique for monitoring three-dimensional motility of growth cone filopodia and demonstrate that an individual filopodium rotates on its own longitudinal axis in the right-screw direction from the viewpoint of the growth cone body. We also show that the filopodial rotation involves myosins Va and Vb and may be driven by their spiral interactions with filamentous actin. Furthermore, we provide evidence that the unidirectional rotation of filopodia causes deflected neurite elongation, most likely via asymmetric positioning of the filopodia onto the substrate. Although the growth cone itself has been regarded as functionally symmetric, our study reveals the asymmetric nature of growth cone motility.


Figures

Figure 1.
Figure 1.
The linearity of neurite elongation depends on the dimension of culture substrates and actin filaments. (A and B) Phase-contrast images of hippocampal explants. Neurites from an explant turned rightward on a 2D substrate of PDL/laminin (A) but grew practically straight in a 3D substrate of collagen gels (B). B is a composite of four photomicrographs. (C) DIC and phalloidin fluorescent images of growth cones in the absence (no treatment) or presence of cytochalasin D. Treatment with 10 ng/ml cytochalasin D inhibited the formation of filopodia. (D–G) Hippocampal explants on PDL/laminin substrates in the absence (D) or presence of cytochalasin D at concentrations of 1 ng/ml (E), 10 ng/ml (F), or 100 ng/ml (G). (H) The y axis represents the curvature of neurites on PDL/laminin substrates, with positive values indicating rightward turning. Numbers in parentheses indicate the total number of neurites examined. Data represent mean ± SEM. ***, P < 0.001 versus no treatment (Bonferroni’s multiple comparison test). Bars: (A, B, and D–G) 500 µm; (C) 10 µm.
Figure 2.
Figure 2.
Individual filopodia rotate in the direction of a right-handed screw. (A) Time-lapse DIC images of filopodia of a single growth cone in a 3D collagen gel. (inset) Cartoon showing the experimental setup of a growth cone migrating in the gel (dark pink) toward the objective lens (gray). The focal plane was positioned at the level of the filopodial tips. Representative trajectories of the filopodial tips are indicated by series of color-coded diamonds. Each color corresponds to the single filopodium tracked for a maximum of 100 s. Each diamond represents the position of the tip at 1-s intervals. (B) The line traces indicate the paths of the single filopodial tips shown in A. Arrows indicate the direction of movement, showing that the filopodia display a general tendency to rotate counterclockwise from the observer’s perspective. (C) Time-lapse DIC images and representative trajectories of filopodia of a growth cone that has protruded from a collagen gel (dark pink) into a liquid medium (light pink). Each color corresponds to the single filopodium tracked for a maximum of 100 s. Each diamond represents the position of the tip at 1-s intervals. (D) The line traces indicate the paths of the single filopodial tips shown in C. Arrows indicate the direction of movement. (E) Schematic diagram of a growth cone showing individual filopodia rotating in the right-screw direction on their longitudinal axis. Original image data of A and C can be found in DataViewer. Bar, 5 µm.
Figure 3.
Figure 3.
The head domain of myosin Va or Vb inhibits the filopodial rotation. (A–D) The line sketches in each panel show trajectories of filopodial tips of a single growth cone that expresses Venus (A), MyoVaHD-Venus (B), MyoVbHD-Venus (C), or MyoVcHD-Venus (D). Each color corresponds to a single filopodium. All of the filopodial tips that appeared in the focal plane for a period of 5-min imaging were included in this study. The numbered end of each line represents the point where a filopodial tip first appeared in the focal plane, and the other end of the line is the point at which it moved out of the focal plane. The mean angular velocity (ω) and the mean velocity (v) of filopodial tips for each growth cone are shown. Positive and negative values of the angular velocity indicate right- and left-screw rotation, respectively.
Figure 4.
Figure 4.
Full-length myosin Va or Vb rescues the filopodial rotation in neurons expressing the myosin Va head domain. (A–D) The line sketches in each panel show trajectories of filopodial tips of a single growth cone that expresses MyoVaHD-Venus plus MyoVa/IRES/mRFP (A), MyoVaHD-Venus plus MyoVb/IRES/mRFP (B), MyoVaHD-Venus plus MyoVc/IRES/mRFP (C), or MyoVaHD-Venus plus mRFP (D). Each color corresponds to a single filopodium. All of the filopodial tips that appeared in the focal plane for a period of 5-min imaging were included in this study. The numbered end of each line represents the point where a filopodial tip first appeared in the focal plane, and the other end of the line is the point at which it moved out of the focal plane. The mean angular velocity (ω) and the mean velocity (v) of filopodial tips for each growth cone are shown. Positive values of the angular velocity indicate right-screw rotation.
Figure 5.
Figure 5.
The involvement of myosin V in filopodial rotation. (A and B) The y axis represents the filopodial angular velocity (A) or the filopodial velocity (B) in growth cones that express the indicated transgene products. Positive and negative values of the angular velocity indicate right- and left-screw rotation, respectively. Numbers in parentheses indicate the total number of growth cones examined. Data represent mean ± SEM. *, P < 0.05; **, P < 0.01; ***, P < 0.001 (Bonferroni’s multiple comparison test).
Figure 6.
Figure 6.
The involvement of myosin V in inherent neurite turning. (A–D) Hippocampal neurons, which had been transfected with cDNAs for Venus (A), MyoVaHD-Venus (B), MyoVaHD-Venus plus MyoVa/IRES/mRFP (C), or MyoVaHD-Venus plus mRFP (D), were reaggregated and plated on 2D PDL/laminin substrates. Each panel is a composite of 30 fluorescent images acquired under the same optical conditions, which causes both saturation and stray light artifacts in the central images where the neuronal cell bodies are concentrated. In the cases of double transfection (C and D), Venus fluorescence (green) and mRFP fluorescence (magenta) have been superimposed. (E) The y axis represents the curvature of the distal 100 µm of neurites that express the indicated transgene products. Positive values represent rightward turning. ***, P < 0.001 (Bonferroni’s multiple comparison test). (F) The y axis represents the estimated length of neurites that express the indicated transgene products. (E and F) Numbers in parentheses indicate the total number of neurites examined. Data represent mean ± SEM. Bar, 200 µm.
Figure 7.
Figure 7.
Correlation between filopodial dynamics and neurite turning. (A) A scatter plot of the curvature of neurites (data in Fig. 6 E) versus the angular velocity of filopodia (data in Fig. 5 A) expressing the indicated transgene products. The correlation was statistically significant (P < 0.05). (B) A scatter plot of the curvature of neurites (data in Fig. 6 E) versus the velocity of filopodia (data in Fig. 5 B). The correlation was statistically significant (P < 0.01). (A and B) The broken lines show the linear regression fit of the data. (C) A scatter plot of the curvature of neurites (data in Fig. 6 E) versus the length of neurites (data in Fig. 6 F). The correlation was not statistically significant (P = 0.47).
Figure 8.
Figure 8.
Quantitative analysis of growth cone–substrate adhesiveness. The adhesiveness of growth cones expressing the indicated transgene products was measured by blasting assays. Blast durations required to dislodge growth cones are shown as dot blots. The duration value was taken as 500 ms when a growth cone had not been dislodged by a 500-ms blast. Each circle corresponds to a single growth cone. Horizontal bars indicate the median and the interquartile range. Numbers in parentheses indicate the total number of growth cones examined. ***, P < 0.001 (Dunn’s multiple comparison test).
Figure 9.
Figure 9.
Temporal correlation between filopodial deviation and growth cone deflection. (A) DIC images of a single growth cone at two time points at three focal planes, each separated by 1 µm in the z direction. All of the filopodial tips in the bottom plane, focused at the level of the coverglass, are marked with red diamonds (left), those in the middle plane with blue diamonds (middle), and those in the top plane with green diamonds (right). The growth cone center is marked with a magenta circle. The horizontal axis shown below the lower right panel was used to determine the tangential components of displacement/velocity of the growth cone center and relative position of the filopodial tips. (B) Tangential displacement of the growth cone (GC) shown in A, with positive and negative values indicating rightward and leftward displacement, respectively. (C) Tangential velocity of the same growth cone. Central difference quotients of the tangential displacement with 80-s intervals are shown. (D–F) Superimposition of the growth cone tangential velocity and the relative position of filopodia (FP) in the indicated focal planes. The filopodia relative position was defined as the tangential component of the distance between the growth cone center and the centroid of filopodia tips. The colored lines represent 80-s central moving averages of the filopodia relative position. (G) The cross-correlation function between the filopodia relative position and the growth cone velocity. Bar, 5 µm.

Similar articles

Cited by

References

    1. Ali M.Y., Uemura S., Adachi K., Itoh H., Kinosita K., Jr., Ishiwata S. 2002. Myosin V is a left-handed spiral motor on the right-handed actin helix. Nat. Struct. Biol. 9:464–467 10.1038/nsb803 - DOI - PubMed
    1. Bentley D., Toroian-Raymond A. 1986. Disoriented pathfinding by pioneer neurone growth cones deprived of filopodia by cytochalasin treatment. Nature. 323:712–715 10.1038/323712a0 - DOI - PubMed
    1. Bridgman P.C. 1999. Myosin Va movements in normal and dilute-lethal axons provide support for a dual filament motor complex. J. Cell Biol. 146:1045–1060 10.1083/jcb.146.5.1045 - DOI - PMC - PubMed
    1. Bridgman P.C. 2004. Myosin-dependent transport in neurons. J. Neurobiol. 58:164–174 10.1002/neu.10320 - DOI - PubMed
    1. Campbell R.E., Tour O., Palmer A.E., Steinbach P.A., Baird G.S., Zacharias D.A., Tsien R.Y. 2002. A monomeric red fluorescent protein. Proc. Natl. Acad. Sci. USA. 99:7877–7882 10.1073/pnas.082243699 - DOI - PMC - PubMed

Publication types