. 2010 Feb 8;188(3):369-81.
doi: 10.1083/jcb.200905057. Epub 2010 Feb 1.

Proliferation of aneuploid human cells is limited by a p53-dependent mechanism

Affiliations

Proliferation of aneuploid human cells is limited by a p53-dependent mechanism

Sarah L Thompson et al. J Cell Biol. .

Abstract

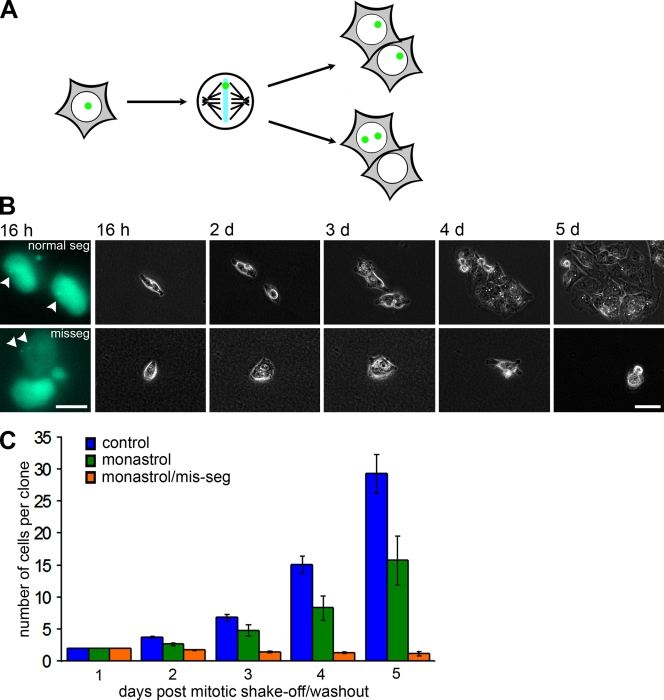
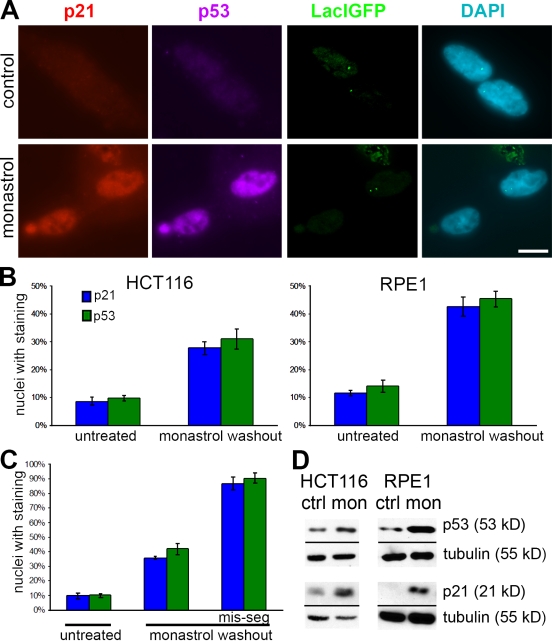
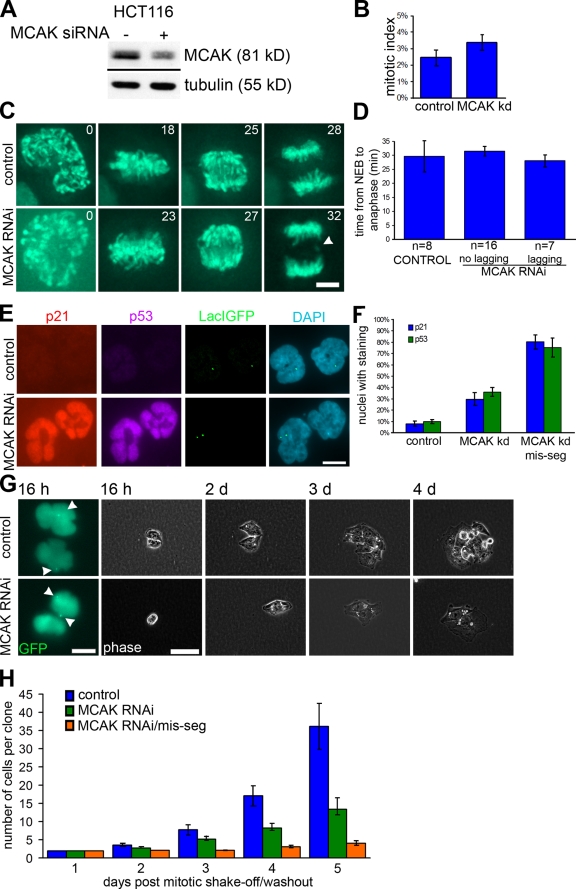
Most solid tumors are aneuploid, and it has been proposed that aneuploidy is the consequence of an elevated rate of chromosome missegregation in a process called chromosomal instability (CIN). However, the relationship of aneuploidy and CIN is unclear because the proliferation of cultured diploid cells is compromised by chromosome missegregation. The mechanism for this intolerance of nondiploid genomes is unknown. In this study, we show that in otherwise diploid human cells, chromosome missegregation causes a cell cycle delay with nuclear accumulation of the tumor suppressor p53 and the cyclin kinase inhibitor p21. Deletion of the p53 gene permits the accumulation of nondiploid cells such that CIN generates cells with aneuploid genomes that resemble many human tumors. Thus, the p53 pathway plays an important role in limiting the propagation of aneuploid human cells in culture to preserve the diploid karyotype of the population. These data fit with the concordance of aneuploidy and disruption of the p53 pathway in many tumors, but the presence of aneuploid cells in some normal human and mouse tissues indicates that there are known exceptions to the involvement of p53 in aneuploid cells and that tissue context may be important in how cells respond to aneuploidy.


Figures

Figure 1.
Figure 1.
HCT116 cells with a single marked chromosome. Interphase (top left) and anaphase (bottom left) cells and a chromosome spread (right) with LacIGFP (green) bound to multiple copies of lacO integrated at a single chromosomal locus. DNA is stained with DAPI (blue). Bar, 10 µm.
Figure 2.
Figure 2.
Growth arrest after chromosome missegregation. (A) Schematic for proper segregation and missegregation of a single GFP-marked chromosome. (B) GFP (left) and phase-contrast images of daughter cells that either segregated the marked chromosome normally (top) or abnormally (bottom) at the indicated times after drug washout. Arrowheads point to the LacIGFP/lacO chromosome mark. (C) Number of cells per clone after no treatment, monastrol washout, and monastrol washout with missegregation (mis-seg) of the marked chromosome. Bars represent mean ± SEM (independent clones counted for control, n = 49; monastrol, n = 15; and monastrol/mis-seg, n = 22). Bars: (B, left) 10 µm; (B, right) 50 µm.
Figure 3.
Figure 3.
p21 and p53 expression after chromosome missegregation. (A) HCT116 cells that have properly segregated (top) or missegregated (bottom) the marked chromosome 24 h after no treatment (top) or monastrol washout (bottom) were stained for p21, p53, and DAPI and with LacIGFP as indicated. (B) Percentage of nuclei staining positive for p21 and p53 24 h after control and monastrol washout in populations of HCT116 (left) and RPE1 (right) cells. Bars represent mean ± SEM of at least three experiments (>300 nuclei counted per condition per experiment). (C) Percentage of nuclei staining positive for p21 and p53 in chromosomally marked HCT116 cell line after control or monastrol washout in pairs of daughter cells that have either properly segregated or missegregated (mis-seg) the marked chromosome. Bars represent mean ± SEM of >180 cells in at least three experiments. (D) Immunoblots of untreated (ctrl) cells or cells after monastrol washout (mon) probed for p21, p53, and tubulin (loading control) in HCT116 and RPE1 cells. Bar, 10 µm.
Figure 4.
Figure 4.
p21 and p53 expression and growth arrest after chromosome missegregation induced by MCAK depletion. (A) Western blot of HCT116 cells 72 h after transfection with MCAK siRNA (+) or no siRNA (−) probing for MCAK and tubulin (loading control). (B) Mitotic indexes of HCT116 cells 72 h after MCAK or mock knockdown (kd). Bars represent mean ± SEM (three experiments; >500 cells in each experiment). (C) Still frames of control (top) or MCAK knockdown (bottom) in HCT116 cells expressing GFP-H2B, with time given in minutes after NEB. A lagging chromosome in MCAK knockdown anaphase is labeled with an arrowhead. (D) Timing (in minutes) from NEB to anaphase onset in HCT116 cells after control or MCAK knockdown. Bars represent mean ± SEM. (E) HCT116 cells that have properly segregated (top) or missegregated (bottom) the marked chromosome in control (top) or MCAK-deficient cells (bottom) stained for p21, p53, and DAPI and with LacIGFP as indicated. (F) Percentage of nuclei positive for p21 and p53 after normal or missegregation (mis-seg) of the marked chromosome in control or MCAK-depleted HCT116 cells. Bars represent mean ± SEM of >150 cells in at least three experiments. (G) GFP (left) and phase-contrast images of daughter cells that segregated the marked chromosome normally (top) or abnormally in MCAK-deficient cells (bottom) at the indicated times after mitotic shake-off. Arrowheads point to the LacIGFP/lacO chromosome mark. (H) Number of cells in each clone after control or MCAK knockdown or MCAK knockdown cells that have missegregated the marked chromosome. Bars represent mean ± SEM (independent clones counted for control, n = 7; MCAK, n = 16; and MCAK/mis-seg, n = 14). Bars: (C) 5 µm; (E and G [left]) 10 µm; (G, right) 60 µm.
Figure 5.
Figure 5.
p53-null HCT116 cells continue to proliferate after missegregation of chromosomes. p53 wild-type (left) and null (right) cells were treated with or without (control) monastrol, and mitotic cells were collected by shake-off, plated, and allowed to proliferate with no further treatment. At 4 h, 2 d, and 6 d, cells were harvested, and FISH was performed using probes specific for chromosomes 3, 7, and 15. For each time point/condition, 600 nuclei were counted per chromosome. Bars represent the mean percent deviation from the modal chromosome number, and error bars show SEM. *, P < 0.05; χ2 test.
Figure 6.
Figure 6.
Inhibition of p38 stress kinase but not MAPK allows proliferation of aneuploid cells. (A and B) HCT116 cells with wild-type p53 and RPE1 cells were treated as described in Fig. 5. After shake-off, cells were grown in the presence of p38 inhibitor (SB203580; A) or MAPK inhibitor (PD98059; B) for the remainder of the experiment. For each time point/condition, 600 nuclei were counted per chromosome. Bars represent the mean percent deviation from the modal chromosome number, and error bars show SEM. *, P < 0.05; χ2 test.

References

    1. Alberts B., Johnson A., Lewis J., Raff M., Roberts K., Walter P. 2002. Molecular Biology of the Cell. Fourth edition Garland Science, New York: 1548 pp
    1. Ambartsumyan G., Clark A.T. 2008. Aneuploidy and early human embryo development. Hum. Mol. Genet. 17:R10–R15 10.1093/hmg/ddn170 - DOI - PubMed
    1. Babu J.R., Jeganathan K.B., Baker D.J., Wu X., Kang-Decker N., van Deursen J.M. 2003. Rae1 is an essential mitotic checkpoint regulator that cooperates with Bub3 to prevent chromosome missegregation. J. Cell Biol. 160:341–353 10.1083/jcb.200211048 - DOI - PMC - PubMed
    1. Baker S.J., Preisinger A.C., Jessup J.M., Paraskeva C., Markowitz S., Willson J.K., Hamilton S., Vogelstein B. 1990. p53 gene mutations occur in combination with 17p allelic deletions as late events in colorectal tumorigenesis. Cancer Res. 50:7717–7722 - PubMed
    1. Baker D.J., Jeganathan K.B., Cameron J.D., Thompson M., Juneja S., Kopecka A., Kumar R., Jenkins R.B., de Groen P.C., Roche P., van Deursen J.M. 2004. BubR1 insufficiency causes early onset of aging-associated phenotypes and infertility in mice. Nat. Genet. 36:744–749 10.1038/ng1382 - DOI - PubMed

Publication types

Substances