. 2010 Apr;184(4):1133-9.
doi: 10.1534/genetics.109.113423. Epub 2010 Feb 1.

The effect of recombination on the reconstruction of ancestral sequences

Affiliations

The effect of recombination on the reconstruction of ancestral sequences

Miguel Arenas et al. Genetics. 2010 Apr.

Abstract

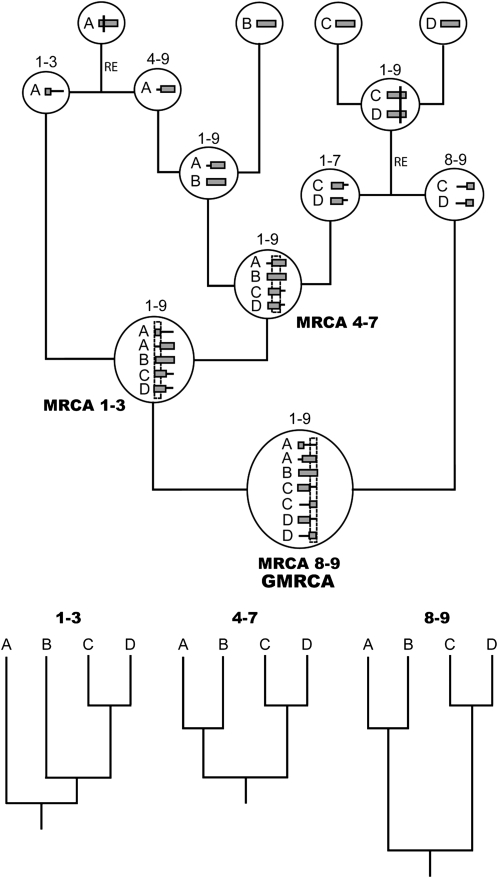
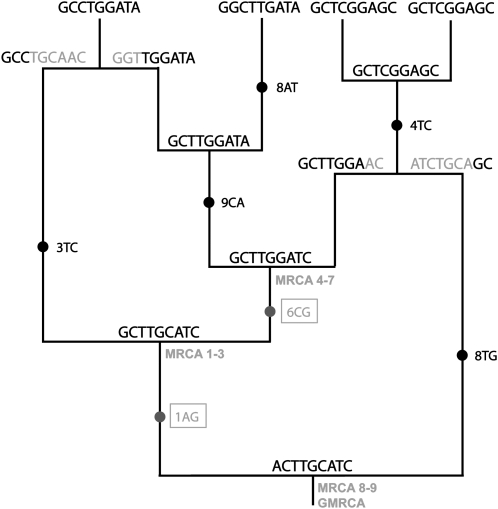
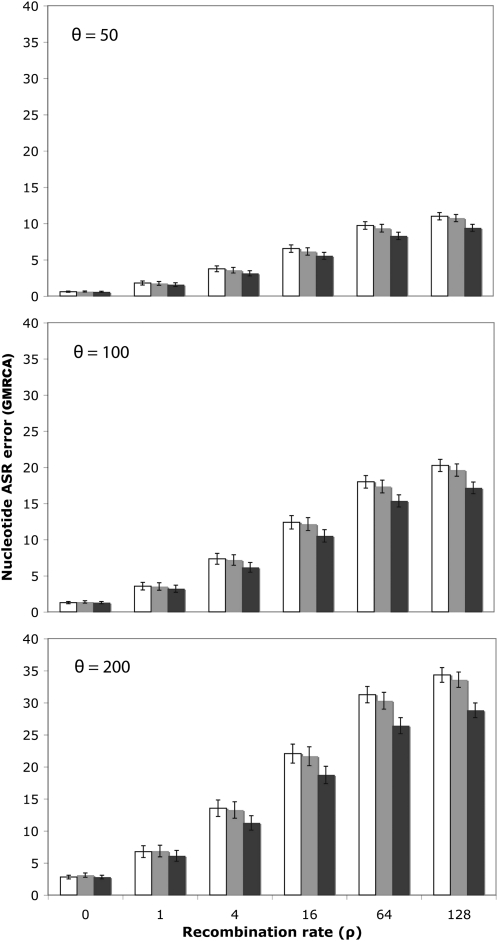
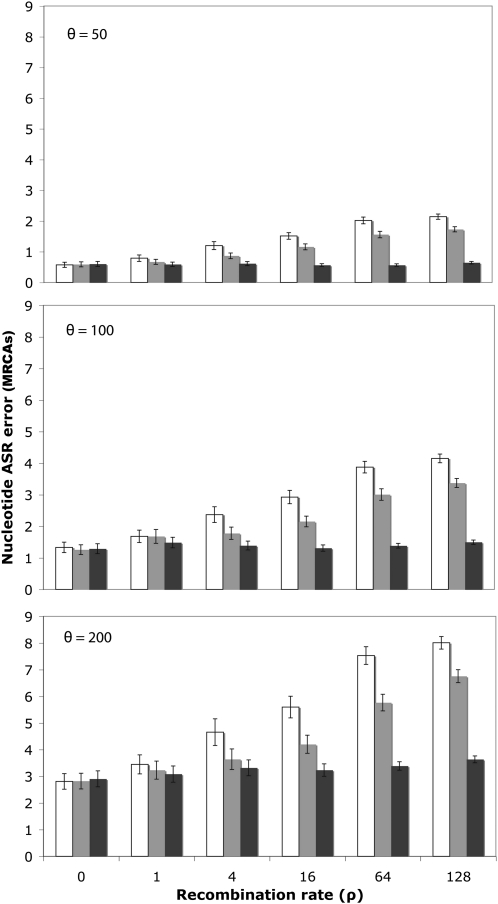
While a variety of methods exist to reconstruct ancestral sequences, all of them assume that a single phylogeny underlies all the positions in the alignment and therefore that recombination has not taken place. Using computer simulations we show that recombination can severely bias ancestral sequence reconstruction (ASR), and quantify this effect. If recombination is ignored, the ancestral sequences recovered can be quite distinct from the grand most recent common ancestor (GMRCA) of the sample and better resemble the concatenate of partial most recent common ancestors (MRCAs) at each recombination fragment. When independent phylogenetic trees are assumed for the different recombinant segments, the estimation of the fragment MRCAs improves significantly. Importantly, we show that recombination can change the biological predictions derived from ASRs carried out with real data. Given that recombination is widespread on nuclear genes and in particular in RNA viruses and some bacteria, the reconstruction of ancestral sequences in these cases should consider the potential impact of recombination and ideally be carried out using approaches that accommodate recombination.


Figures

F<sc>igure</sc> 1.—
Figure 1.—
Example of an ancestral recombination graph. Inside each node (circles) there are recombinant segments with ancestral (shaded horizontal blocks) and nonancestral material (horizontal lines). RE indicates recombination events. Vertical lines across the segments indicate recombination breakpoints. Numbers above nodes indicate the nucleotide interval of ancestral material included. Note that each independent recombinant fragment (1–3, 4–7, and 8–9) has its own most recent common ancestor (MRCA), all of which finally coalesce into a grand most recent common ancestor (GMRCA). At the bottom, we can see the individual trees corresponding to each recombinant fragment.
F<sc>igure</sc> 2.—
Figure 2.—
Example of the evolution of nucleotides on the ancestral recombination graph in Figure 1. Substitutions along branches are marked with solid circles, followed by the position and the states involved. The two changes that occur between the GMRCA and the MRCAs (enclosed in a box and shaded) are fixed in the sampled sequences, so the corresponding ancestral states in the GMRCA (1A and 6C) cannot be recovered from this sample.
F<sc>igure</sc> 3.—
Figure 3.—
Nucleotide ASR error as a function of the recombination rate. The percentage of nucleotide differences is shown between the inferred and the simulated GMRCA sequences, ignoring recombination (open), using the fragments and trees inferred by GARD (shaded), or using the simulated (true) fragments and trees (solid) for different levels of diversity (θ) and recombination (ρ). Error bars indicate 95% confidence intervals. In the example shown, ancestral nucleotide sequences were inferred using joint ML in HYPHY.
F<sc>igure</sc> 4.—
Figure 4.—
Error in the reconstruction of the fragment MRCAs as a function of the recombination rate. The percentage of nucleotide differences is shown between the inferred and the simulated fragment MRCAs sequences, ignoring recombination (open), using the fragments and trees inferred by GARD (shaded), or using the simulated (true) fragments and trees (solid) for different levels of divergence (θ) and recombination (ρ). Error bars indicate 95% confidence intervals. In this case ancestral nucleotide sequences were inferred using joint ML in HYPHY.

References

    1. Arenas, M., and D. Posada, 2010. Coalescent simulation of intracodon recombination. Genetics 184 429–437. - PMC - PubMed
    1. Awadalla, P., 2003. The evolutionary genomics of pathogen recombination. Nat. Rev. Genet. 4 50–60. - PubMed
    1. Beiko, R. G., W. F. Doolittle and R. L. Charlebois, 2008. The impact of reticulate evolution on genome phylogeny. Syst. Biol. 57 844–856. - PubMed
    1. Boussau, B., S. Blanquart, A. Necsulea, N. Lartillot and M. Gouy, 2008. Parallel adaptations to high temperatures in the Archaean eon. Nature 456 942–945. - PubMed
    1. Cai, W., J. Pei and N. V. Grishin, 2004. Reconstruction of ancestral protein sequences and its applications. BMC Evol. Biol. 4 33. - PMC - PubMed

Publication types