. 2010 Mar 1;184(5):2693-701.
doi: 10.4049/jimmunol.0901362. Epub 2010 Feb 1.

Intrahepatic IL-10 maintains NKG2A+Ly49- liver NK cells in a functionally hyporesponsive state

Affiliations

Intrahepatic IL-10 maintains NKG2A+Ly49- liver NK cells in a functionally hyporesponsive state

Matthew G Lassen et al. J Immunol. .

Abstract

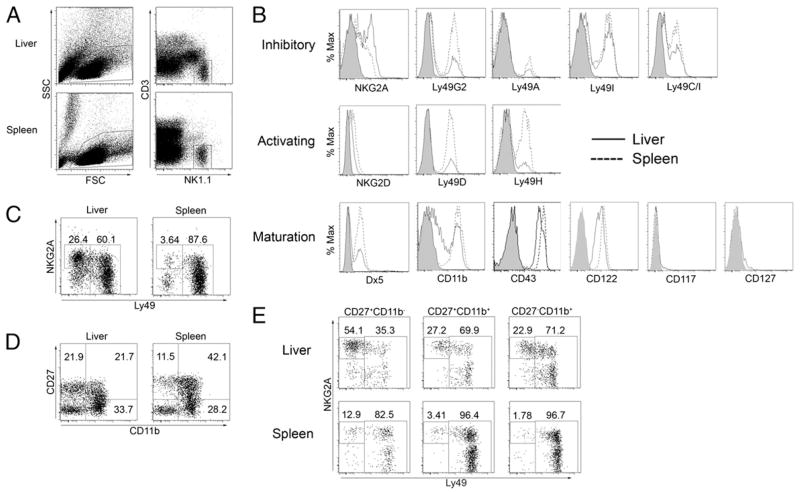
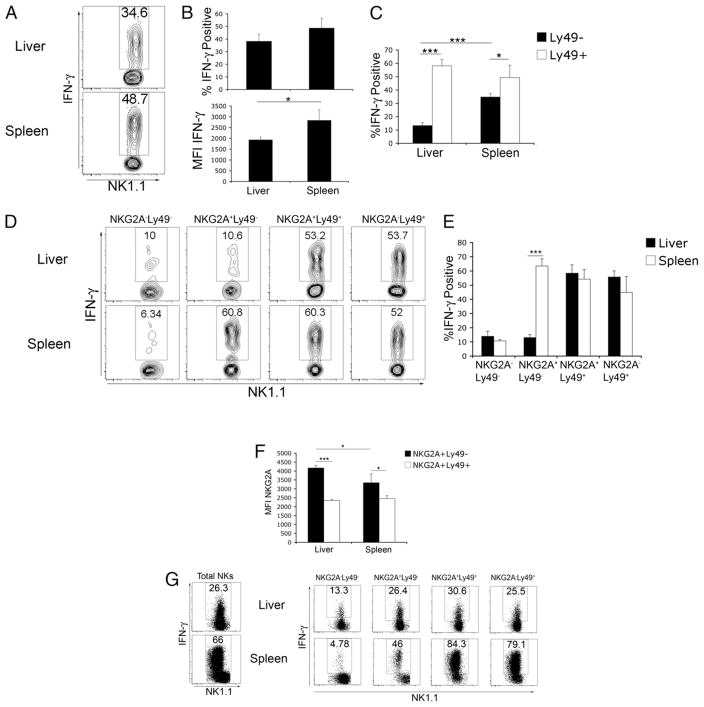
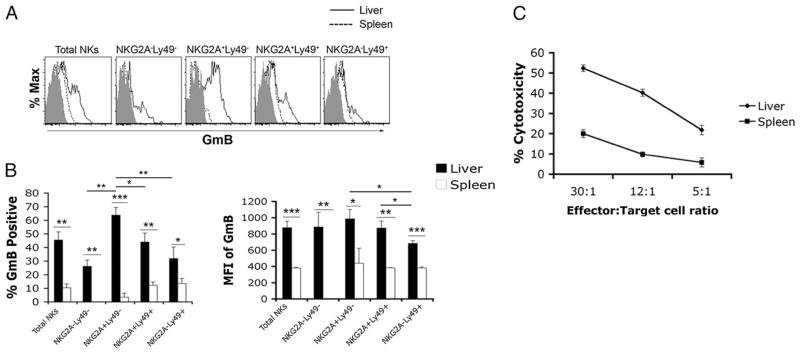
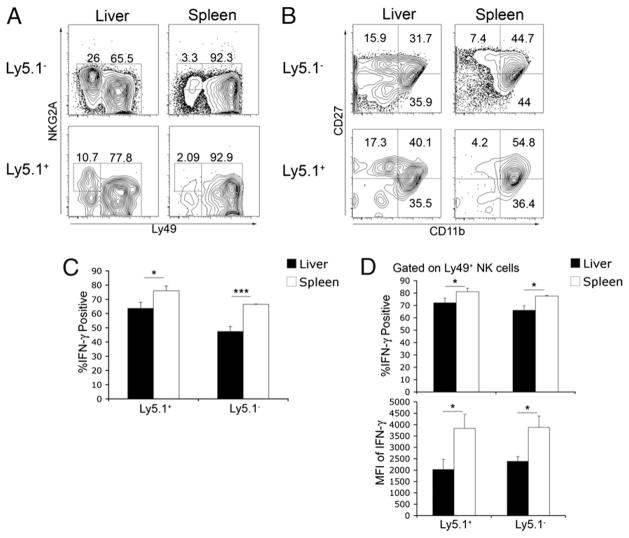
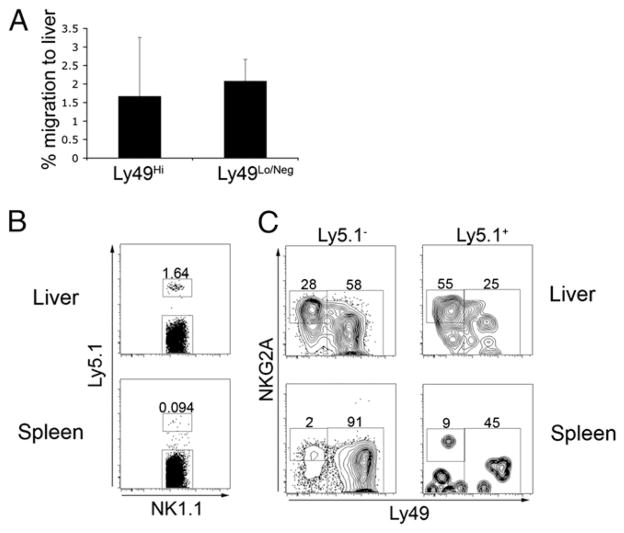
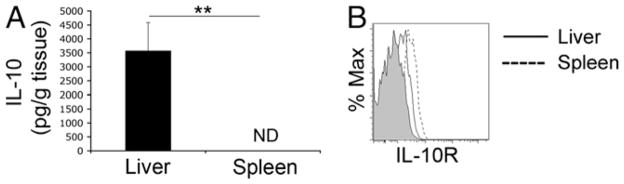
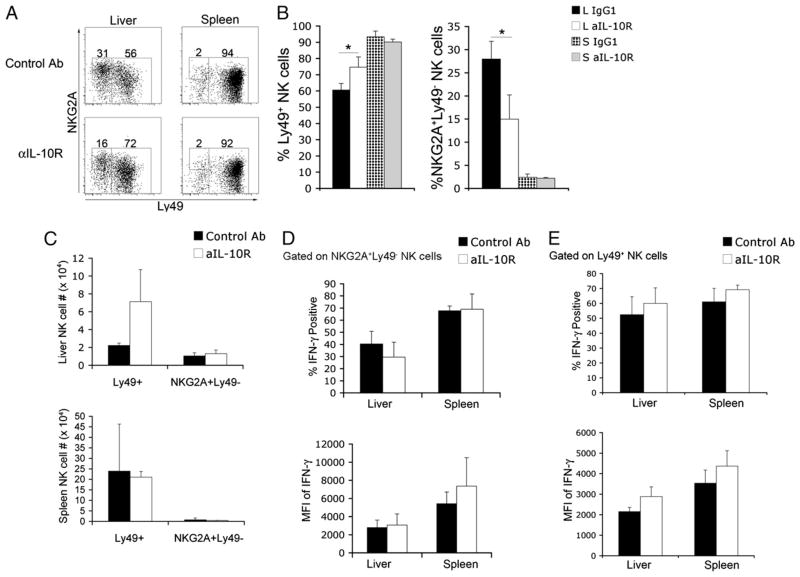
The tolerogenic nature of the liver allows daily exposure to gut-derived foreign Ags without causing inflammation, but it may facilitate persistent infection in the liver. NK cells play a central role in innate immunity, as well as in shaping the adaptive immune response. We hypothesized that the naive mouse liver maintains intrahepatic NK cells in a functionally hyporesponsive state. Compared with splenic NK cells, liver NK cells displayed a dampened IFN-gamma response to IL-12/IL-18 stimulation. Importantly, the liver contains a significant population of functionally hyporesponsive NK cells that express high levels of the inhibitory receptor NKG2A and lack expression of MHC class I-binding Ly49 receptors. Adoptively transferred splenic NK cells that migrate to the liver displayed phenotypic and functional changes, suggesting that the liver environment modifies NK cell receptor expression and functional responsiveness. Notably, IL-10 is present at high levels within the liver, and in vivo blockade of IL-10R resulted in a decreased percentage of intrahepatic NKG2A(+)Ly49(-) NK cells. These data suggest that the liver environment regulates NK cell receptor expression and that IL-10 contributes to the regulation of liver NK cells, in part, by maintaining a greater percentage of the hyporesponsive NKG2A(+)Ly49(-) NK cells in the liver.


Conflict of interest statement

Disclosures

The authors have no financial conflicts of interest.

Figures

FIGURE 1
FIGURE 1
NK cell receptor expression profile indicates liver contains a large proportion of immature NK cells. Liver and spleen tissue was harvested from 6- to 10-wk-old naive female C57BL/6 mice. Total leukocytes were isolated and stained for various NK cell receptors. A, NK cells are defined throughout this article as NK1.1+ cells lacking CD3 expression. B, Expression of various NK cell receptors on gated liver (solid line) and spleen (dashed line) NK cells. Shaded curves represent isotype control staining. C, Liver and spleen NK cell subsets according to surface expression of NKG2A and a mixture of Ly49 receptors (C/I/F/H/G2). D, Liver and spleen NK cell subsets gated according to surface expression of CD27 and CD11b. E, NKG2A/Ly49 expression on CD27+CD11b, CD27+CD11b+, and CD27CD11b+ subsets of liver and spleen NK cells. Data are representative of at least three independent experiments using at least three mice per group.
FIGURE 2
FIGURE 2
Liver NKG2A+Ly49 NK cells are hyporesponsive to cytokine stimulation. AE, Total female C57BL/6 liver or spleen leukocytes were stimulated with IL-12 and -18, followed by intracellular staining for IFN-γ. Plots are gated on CD3NK1.1+ cells. A, IFN-γ production by total liver and spleen NK cells. B, Combined results from a single experiment showing the percentage of IFN-γ+ liver and spleen NK cells as well as mean fluorescent intensity of intracellular IFN-γ staining. C, Combined results from a single experiment of IFN-γ production by Ly49 and pan NK Ly49+ (C/I/F/H/G2) NK cells. D, IFN-γ production by NK cell subsets based on NKG2A and pan Ly49 expression. E, Combined results from a single experiment showing intracellular IFN-γ staining by NK cell subsets gated according to NKG2A and pan NK Ly49 expression. F, Combined results from a single experiment of mean fluorescent intensity of NKG2A staining on Ly49+ and Ly49 NK cells. G, Dot plots of intracellular IFN-γ staining in cell-sorted total NK cells and flow-gated NK cell subsets. Data in AF are representative of three independent experiments containing three mice per experiment. Data in G are representative of two independent experiments containing NK cells sorted from at least six mice. *p < 0.05; ***p < 0.0005.
FIGURE 3
FIGURE 3
Higher granzyme B levels in liver NK cells correlates with enhanced cytotoxic activity. Liver and spleen leukocytes were isolated from naive C57BL/6 mice as before. A, Representative dot plots showing intracellular levels of granzyme B in liver and spleen NK cells. B, Combined results from a single experiment of positive percentage and mean fluorescent intensity of granzyme B intracellular staining. C, Liver and spleen NK cells were purified from 8- to 12-wk-old naive female C57BL/6 mice. Purified NK cells were cocultured with CFSE-labeled YAC-1 target cells at an E:T ratio of 30:1, 12:1, or 5:1 at 37°C for 4 h. Following the coculture, dead cells were detected by TO-PRO-3 staining measured by FACS analysis. Dead target cells were defined as CFSE+TO-PRO-3+ cells. Cytotoxicity percent was calculated as the percentage of target cell death in NK:target cell cocultures minus the spontaneous target cell death (YAC-1 cells cultured in the absence of NK cells). Data in A and B are representative of at least two independent experiments containing three mice. Data in C are representative of two independent experiments using purified NK cells pooled from ≥12 mice. *p < 0.05; **p < 0.005; ***p < 0.0005.
FIGURE 4
FIGURE 4
Splenic NK cells that migrate to the liver display greater immature phenotype and decreased IFN-γ production. Splenic NK cells were isolated from 6- to10-wk-old naive female Ly5.1 congenic C57BL/6 mice. Approximately 6 × 10⁵ Ly5.1+ NK cells were adoptively transferred i.v. into C57BL/6 mice (Ly5.2+). Forty-eight hours posttransfer, liver and spleen leukocytes were isolated and stained for CD3, NK1.1, Ly5.1, and various NK cell receptors. Plots represent data from CD3NK1.1+-gated cells. A, Staining for NKG2A and Ly49 receptors on adoptively transferred (Ly5.1+) and endogenous (Ly5.1) NK cells. B, Staining for CD27 and CD11b molecules on adoptively transferred (Ly5.1+) and endogenous (Ly5.1) NK cells. C, Combined results of IFN-γ production by transferred (Ly5.1+) and endogenous (Ly5.1) total NK cell populations. D, Combined results of transferred (Ly5.1+) and endogenous (Ly5.1) Ly49+-gated NK cells. Data are representative of two independent experiments with two or three mice per group. *p <0.05; ***p <0.0005.
FIGURE 5
FIGURE 5
NK cells preferentially migrate back to the organ of isolation. Splenic or liver NK cells were isolated from naive female wild-type (Ly5.2) or Ly5.1 congenic, C57BL/6 mice, respectively, and were transferred i.v. into Ly5-mismatched hosts. Forty-eight hours posttransfer, liver and spleen leukocytes were isolated and stained for CD3, NK1.1, Ly5.1, and various NK cell receptors. Plots represent data from CD3NK1.1+-gated cells. For adoptive transfer of Ly49Hi/Ly49Lo NK cells, Ly5.2+ splenic NK cells were sorted into Ly49Hi and Ly49Lo/Neg populations and adoptively transferred separately into Ly5.1 congenic C57BL/6 mice. A, The percentage of cells that migrated to the liver was calculated by dividing the absolute number of transferred cells that migrated to the liver by the absolute number of transferred cells that migrated to the spleen and liver ([liver absolute no./(spleen absolute no. + liver absolute no.)] ×100). Data are combined from two independent experiments. B, Ly5.1+ liver NK cells were adoptively transferred i.v. and detected in liver and spleen 48 h. posttransfer. C, NKG2A and pan Ly49 staining on transferred (Ly5.1+) and endogenous (Ly5.1) NK cells. Data in B and C are representative of two independent experiments with two or three mice per group.
FIGURE 6
FIGURE 6
Liver contains high levels of IL-10. A, Liver and spleen tissue was isolated from naive 6- to 10-wk-old C57BL/6 female mice and weighed prior to homogenization. Tissue was gently homogenized in Iscove’s media using a glass pestle. Cells and debris were pelleted by centrifugation, and supernatants were collected and stored at −80°C. IL-10 levels were measured in triplicate by ELISA. Cytokine levels represent positive signal above background (wells containing no capture Ab). **p <0.005. B, IL-10R expression on total liver (solid line) and spleen (dashed line) NK cells. Shaded graph represents isotype control staining. Data are representative of three independent experiments using three mice.
FIGURE 7
FIGURE 7
IL-10R blockade shifts liver NK cell subsets to a greater proportion of Ly49-expressing NK cells. Six- to 10-wk-old female C57BL/6 mice were injected i.p. with 250 μg of IL-10R–blocking Ab or isotype control every 2 d over a 6-d period. Total leukocytes were isolated from liver and spleen tissue. A, Expression of NKG2A and Ly49 receptors on liver and spleen NK cells from control and anti-IL-10R–treated mice. B, Combined results from a single experiment showing NKG2A+Ly49 and Ly49+ NK cell subsets. *p <0.05. C, Combined results from a single experiment showing absolute numbers of Ly49+ and NKG2A+ Ly49 NK cells following IL-10R blockade or control Ab injection. Combined results of a single experiment displaying the percentage of IFN-γ+ NK cells and the mean fluorescence intensity of intracellular IFN-γ staining in liver and spleen NKG2A+Ly49 (D) and Ly49+ (E) NK cells from control and anti-IL-10R–treated mice. Data showing surface expression of NKG2A and Ly49 receptors are representative of three independent experiments, and intracellular IFN-γ staining is representative of two independent experiments using three mice per group.

Similar articles

Cited by

References

    1. Andrews DM, Scalzo AA, Yokoyama WM, Smyth MJ, Degli-Esposti MA. Functional interactions between dendritic cells and NK cells during viral infection. Nat Immunol. 2003;4:175–181. - PubMed
    1. Martín-Fontecha A, Thomsen LL, Brett S, Gerard C, Lipp M, Lanzavecchia A, Sallusto F. Induced recruitment of NK cells to lymph nodes provides IFN-gamma for T(H)1 priming. Nat Immunol. 2004;5:1260–1265. - PubMed
    1. Lodoen MB, Lanier LL. Natural killer cells as an initial defense against pathogens. Curr Opin Immunol. 2006;18:391–398. - PMC - PubMed
    1. Kim S, Iizuka K, Kang HS, Dokun A, French AR, Greco S, Yokoyama WM. In vivo developmental stages in murine natural killer cell maturation. Nat Immunol. 2002;3:523–528. - PubMed
    1. Dorfman JR, Raulet DH. Acquisition of Ly49 receptor expression by developing natural killer cells. J Exp Med. 1998;187:609–618. - PMC - PubMed

Publication types

MeSH terms