Gene expression profiling for survival prediction in pediatric rhabdomyosarcomas: a report from the children's oncology group
- PMID: 20124188
- PMCID: PMC3040045
- DOI: 10.1200/JCO.2008.21.1268
Gene expression profiling for survival prediction in pediatric rhabdomyosarcomas: a report from the children's oncology group
Abstract
Purpose: We investigated whether tumors from diagnostic biopsies of primary rhabdomyosarcoma (RMS) contain relevant prognostic information in the form of gene expression signatures that can be used to model and predict outcome of patients.
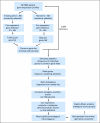
Patients and methods: A 22,000-probe set microarray was used to evaluate 120 RMS specimens and correlate gene expression patterns to survival. Multivariate gene expression models or metagenes were developed using cross-validated Cox regression proportional hazards modeling and were evaluated using Kaplan-Meier analysis.
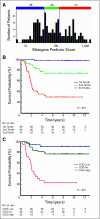
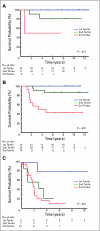
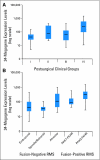
Results: A 34-metagene, based on expression patterns of 34 genes, was highly predictive of outcome. It was not highly correlated with individual clinical risk factors such as patient age, stage, tumor size, or histology. However, it was correlated with a risk classification used by the Children's Oncology Group and the biologic subsets of alveolar histology tumors.
Conclusion: These data support further evaluation of RMS metagenes to discriminate patients with good prognosis from those with poor prognosis, with the potential to direct risk-adapted therapy.
Conflict of interest statement
Authors' disclosures of potential conflicts of interest and author contributions are found at the end of this article.
Figures


Similar articles
-
PAX3/FOXO1 fusion gene status is the key prognostic molecular marker in rhabdomyosarcoma and significantly improves current risk stratification.J Clin Oncol. 2012 May 10;30(14):1670-7. doi: 10.1200/JCO.2011.38.5591. Epub 2012 Mar 26. J Clin Oncol. 2012. PMID: 22454413
-
Survival outcomes of patients with localized FOXO1 fusion-positive rhabdomyosarcoma treated on recent clinical trials: A report from the Soft Tissue Sarcoma Committee of the Children's Oncology Group.Cancer. 2021 Mar 15;127(6):946-956. doi: 10.1002/cncr.33334. Epub 2020 Nov 20. Cancer. 2021. PMID: 33216382 Free PMC article.
-
Clinical Application of Prognostic Gene Expression Signature in Fusion Gene-Negative Rhabdomyosarcoma: A Report from the Children's Oncology Group.Clin Cancer Res. 2015 Oct 15;21(20):4733-9. doi: 10.1158/1078-0432.CCR-14-3326. Clin Cancer Res. 2015. PMID: 26473193 Free PMC article.
-
Uncovering metabolism in rhabdomyosarcoma.Cell Cycle. 2016;15(2):184-95. doi: 10.1080/15384101.2015.1071746. Cell Cycle. 2016. PMID: 26209235 Free PMC article. Review.
-
Molecular biology of rhabdomyosarcoma.Clin Transl Oncol. 2007 Jul;9(7):415-9. doi: 10.1007/s12094-007-0079-3. Clin Transl Oncol. 2007. PMID: 17652054 Review.
Cited by
-
PAX-FOXO1 fusion status drives unfavorable outcome for children with rhabdomyosarcoma: a children's oncology group report.Pediatr Blood Cancer. 2013 Sep;60(9):1411-7. doi: 10.1002/pbc.24532. Epub 2013 Mar 22. Pediatr Blood Cancer. 2013. PMID: 23526739 Free PMC article. Clinical Trial.
-
Inhibition of NR4A1 Promotes ROS Accumulation and IL24-Dependent Growth Arrest in Rhabdomyosarcoma.Mol Cancer Res. 2019 Nov;17(11):2221-2232. doi: 10.1158/1541-7786.MCR-19-0408. Epub 2019 Aug 28. Mol Cancer Res. 2019. PMID: 31462501 Free PMC article.
-
Current and Future Treatment Strategies for Rhabdomyosarcoma.Front Oncol. 2019 Dec 20;9:1458. doi: 10.3389/fonc.2019.01458. eCollection 2019. Front Oncol. 2019. PMID: 31921698 Free PMC article. Review.
-
Age-Related Alterations in Immune Contexture Are Associated with Aggressiveness in Rhabdomyosarcoma.Cancers (Basel). 2019 Sep 17;11(9):1380. doi: 10.3390/cancers11091380. Cancers (Basel). 2019. PMID: 31533233 Free PMC article.
-
Childhood rhabdomyosarcoma: new insight on biology and treatment.Curr Oncol Rep. 2010 Nov;12(6):402-10. doi: 10.1007/s11912-010-0130-3. Curr Oncol Rep. 2010. PMID: 20820958 Review.
References
-
- Stevens MC. Treatment for childhood rhabdomyosarcoma: The cost of cure. Lancet Oncol. 2005;6:77–84. - PubMed
-
- Schuck A, Mattke AC, Schmidt B, et al. Group II rhabdomyosarcoma and rhabdomyosarcomalike tumors: Is radiotherapy necessary? J Clin Oncol. 2004;22:143–149. - PubMed
-
- Crist WM, Anderson JR, Meza JL, et al. Intergroup rhabdomyosarcoma study-IV: Results for patients with nonmetastatic disease. J Clin Oncol. 2001;19:3091–3102. - PubMed
-
- Meza JL, Anderson J, Pappo AS, et al. Analysis of prognostic factors in patients with nonmetastatic rhabdomyosarcoma treated on intergroup rhabdomyosarcoma studies III and IV: The Children's Oncology Group. J Clin Oncol. 2006;24:3844–3851. - PubMed
Publication types
MeSH terms
Substances
Grants and funding
LinkOut - more resources
Full Text Sources
Research Materials
Miscellaneous

