Multicenter Study
. 2010 Apr 8;115(14):2845-51.
doi: 10.1182/blood-2009-07-234377. Epub 2010 Feb 1.

Inactivation of LEF1 in T-cell acute lymphoblastic leukemia

Affiliations
Multicenter Study

Inactivation of LEF1 in T-cell acute lymphoblastic leukemia

Alejandro Gutierrez et al. Blood. .

Abstract

To further unravel the molecular pathogenesis of T-cell acute lymphoblastic leukemia (T-ALL), we performed high-resolution array comparative genomic hybridization on diagnostic specimens from 47 children with T-ALL and identified monoallelic or biallelic LEF1 microdeletions in 11% (5 of 47) of these primary samples. An additional 7% (3 of 44) of the cases harbored nonsynonymous sequence alterations of LEF1, 2 of which produced premature stop codons. Gene expression microarrays showed increased expression of MYC and MYC targets in cases with LEF1 inactivation, as well as differentiation arrest at an early cortical stage of thymocyte development characterized by expression of CD1B, CD1E, and CD8, with absent CD34 expression. LEF1 inactivation was associated with a younger age at the time of T-ALL diagnosis, as well as activating NOTCH1 mutations, biallelic INK4a/ARF deletions, and PTEN loss-of-function mutations or activating mutations of PI3K or AKT genes. These cases generally lacked overexpression of the TAL1, HOX11, HOX11L2, or the HOXA cluster genes, which have been used to define separate molecular pathways leading to T-ALL. Our findings suggest that LEF1 inactivation is an important step in the molecular pathogenesis of T-ALL in a subset of young children.


Figures

Figure 1
Figure 1
LEF1 microdeletions and truncating mutations are recurrent genetic alterations in T-ALL. Array CGH was performed on genomic DNA from diagnostic specimens collected from 47 children with T-ALL. (A) dChip plot of the segmented CGH log2 copy number ratios at the LEF1 genomic locus. Recurrent microdeletions involving LEF1 and no other known genes were identified in 5 (11%) of the 47 primary T-ALL samples. Note that cases 36 and 37 were excluded because CGH quality controls failed. (B-D) Raw CGH log2 copy number ratio data (black dots) shown for 3 representative cases, together with the genomic location of LEF1 exons. The segmented data plotted in panel A are shown as red lines. The y-axis is log2 of the copy number ratio (0 = no copy number change). (E) Sequencing of LEF1 genomic coding sequence identified heterozygous nonsynonymous sequence alterations in 3 (7%) of the 44 T-ALL cases analyzed. Black arrowheads denote the location of predicted truncating mutations, whereas the white arrowhead denotes the missense mutation identified. (F) Sequence chromatograms for representative mutant and wild-type samples, showing the presence of a heterozygous frameshift mutation in sample T-ALL 13.
Figure 2
Figure 2
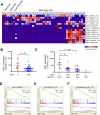
LEF1-inactivated T-ALL is characterized by the overexpression of MYC and of MYC targets. Gene expression profiling was previously performed on 40 of the 47 T-ALL cases analyzed in our study, using Affymetrix U133 Plus 2.0 microarrays. (A) Heatmap showing the expression pattern of known T-ALL oncogenes, based on the expression microarrays applied. Probe sets that showed no significant expression (defined as expression values < 100) in any T-ALL sample were excluded. Low expression values were truncated to 30. Note that data from the [1561651_s_at] TAL1 probe set were excluded because we have found that expression measured by this probe set does not correlate with TAL1 RNA levels (data not shown). (B-C) Expression of MYC by LEF1 and NOTCH1 status. P values were calculated by the Wilcoxon rank-sum test. (D-F) Gene set enrichment analysis showed that 3 of the 4 gene sets most highly up-regulated in LEF1-inactivated T-ALL represent MYC target gene sets.
Figure 3
Figure 3
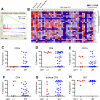
LEF1-inactivated T-ALL is characterized by developmental arrest at an aberrant cortical stage of T-cell differentiation. (A) Gene set enrichment analysis shows that the published gene expression signature of HOX11-positive T-ALL cases, showing T-cell developmental arrest at an early cortical stage of thymocyte differentiation, closely resembles that of LEF1-inactivated T-ALL. (B) Heatmap depicting the results of the gene set enrichment analysis for the HOX11-positive early cortical signature depicted in Figure 1A. (C-H) Results of flow cytometry to detect T-cell surface markers are shown for all cases in which such data were available. Percent Expression denotes the percentage of blasts that were positive for expression of each immunophenotypic marker. Note that the CD1A antibody does not appear to cross-react with CD1B and CD1E, which were highly expressed in all LEF1-inactivated cases analyzed by expression microarray. Taken together, these data indicate that LEF1-inactivated cases of T-ALL show developmental arrest at an aberrant CD1E/CD1B+, CD8+, CD34 cortical stage of T-cell development.
Figure 4
Figure 4
Clinical features associated with LEF1 inactivation. (A-B) Kaplan-Meier analysis of event-free survival rates shows that LEF1 status is not a significant predictor of response to initial therapy; however, there was a trend toward improved overall survival in patients with LEF1-inactivated T-ALL, suggesting that this molecular subtype of the disease may be more responsive to salvage therapy for relapsed T-ALL. (C) LEF1 inactivation is associated with a younger age at the time of T-ALL diagnosis. P value was calculated by the Wilcoxon rank-sum test.

References

    1. Goldberg JM, Silverman LB, Levy DE, et al. Childhood T-cell acute lymphoblastic leukemia: the Dana-Farber Cancer Institute acute lymphoblastic leukemia consortium experience. J Clin Oncol. 2003;21(19):3616–3622. - PubMed
    1. Bassan R, Gatta G, Tondini C, Willemze R. Adult acute lymphoblastic leukaemia. Crit Rev Oncol Hematol. 2004;50(3):223–261. - PubMed
    1. Ferrando AA, Neuberg DS, Staunton J, et al. Gene expression signatures define novel oncogenic pathways in T cell acute lymphoblastic leukemia. Cancer Cell. 2002;1(1):75–87. - PubMed
    1. Ferrando AA, Armstrong SA, Neuberg DS, et al. Gene expression signatures in MLL-rearranged T-lineage and B-precursor acute leukemias: dominance of HOX dysregulation. Blood. 2003;102(1):262–268. - PubMed
    1. Soulier J, Clappier E, Cayuela JM, et al. HOXA genes are included in genetic and biologic networks defining human acute T-cell leukemia (T-ALL). Blood. 2005;106(1):274–286. - PubMed

Publication types

MeSH terms