. 2010 Jun;9(6):1100-17.
doi: 10.1074/mcp.M900398-MCP200. Epub 2010 Feb 1.

Candidate serological biomarkers for cancer identified from the secretomes of 23 cancer cell lines and the human protein atlas

Affiliations

Candidate serological biomarkers for cancer identified from the secretomes of 23 cancer cell lines and the human protein atlas

Chih-Ching Wu et al. Mol Cell Proteomics. 2010 Jun.

Abstract

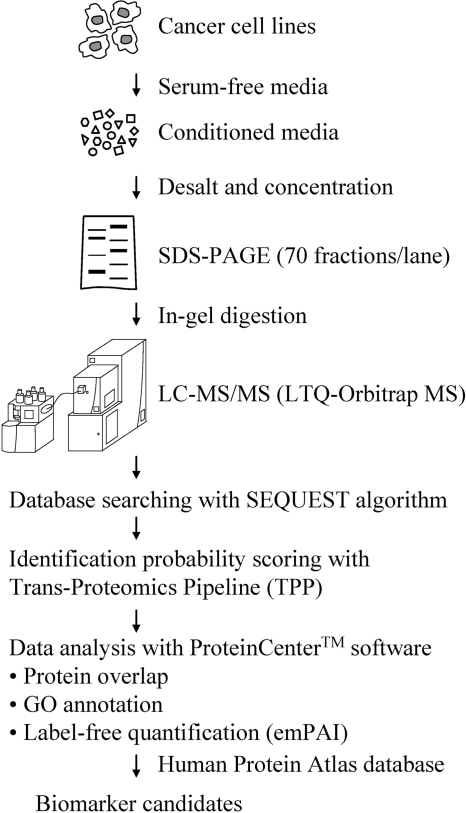
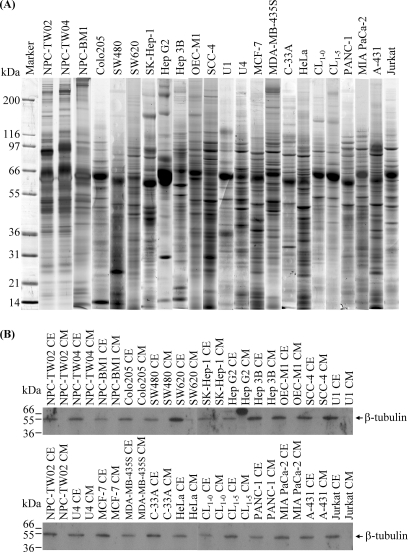
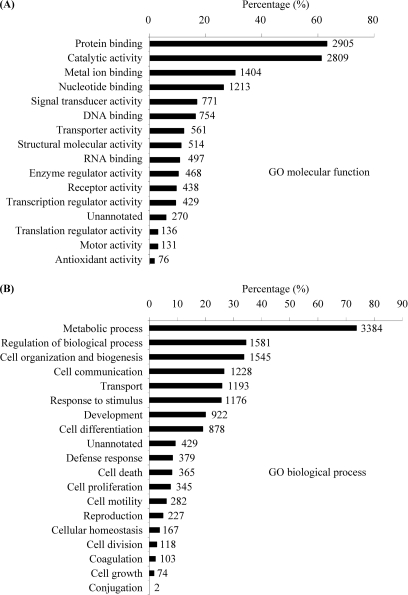
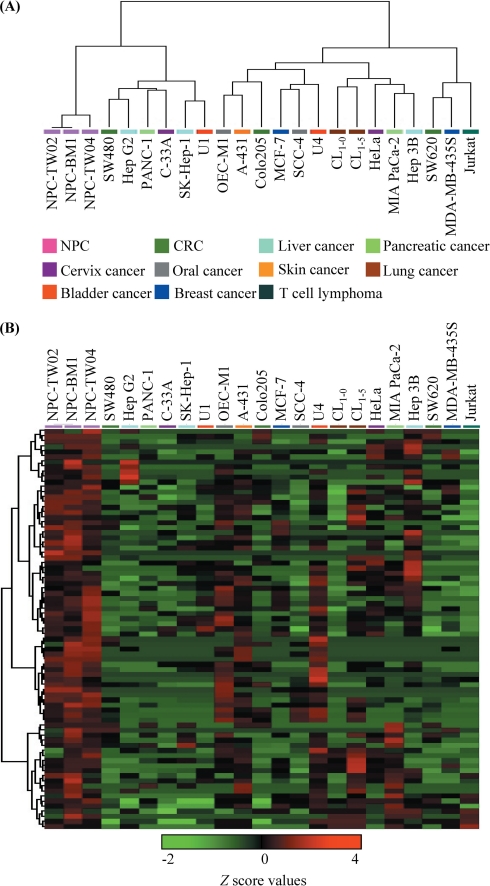
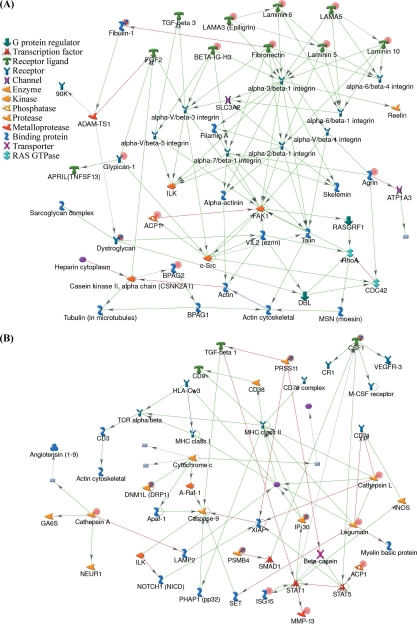
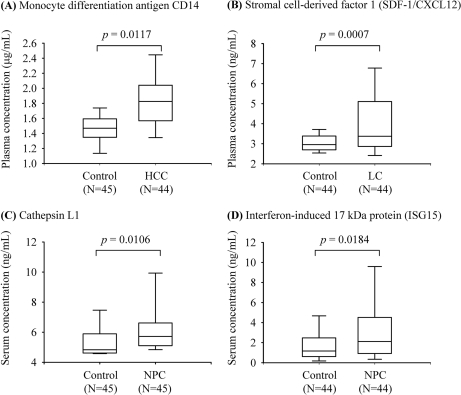
Although cancer cell secretome profiling is a promising strategy used to identify potential body fluid-accessible cancer biomarkers, questions remain regarding the depth to which the cancer cell secretome can be mined and the efficiency with which researchers can select useful candidates from the growing list of identified proteins. Therefore, we analyzed the secretomes of 23 human cancer cell lines derived from 11 cancer types using one-dimensional SDS-PAGE and nano-LC-MS/MS performed on an LTQ-Orbitrap mass spectrometer to generate a more comprehensive cancer cell secretome. A total of 31,180 proteins was detected, accounting for 4,584 non-redundant proteins, with an average of 1,300 proteins identified per cell line. Using protein secretion-predictive algorithms, 55.8% of the proteins appeared to be released or shed from cells. The identified proteins were selected as potential marker candidates according to three strategies: (i) proteins apparently secreted by one cancer type but not by others (cancer type-specific marker candidates), (ii) proteins released by most cancer cell lines (pan-cancer marker candidates), and (iii) proteins putatively linked to cancer-relevant pathways. We then examined protein expression profiles in the Human Protein Atlas to identify biomarker candidates that were simultaneously detected in the secretomes and highly expressed in cancer tissues. This analysis yielded 6-137 marker candidates selective for each tumor type and 94 potential pan-cancer markers. Among these, we selectively validated monocyte differentiation antigen CD14 (for liver cancer), stromal cell-derived factor 1 (for lung cancer), and cathepsin L1 and interferon-induced 17-kDa protein (for nasopharyngeal carcinoma) as potential serological cancer markers. In summary, the proteins identified from the secretomes of 23 cancer cell lines and the Human Protein Atlas represent a focused reservoir of potential cancer biomarkers.


Figures

Fig. 1.
Fig. 1.
Cancer cell secretome profiling via analysis of conditioned media from cancer cell lines. The strategy involves the proteomic profiling of cancer cell-conditioned media, secretome analysis, and subsequent preliminary validation using the HPA.
Fig. 2.
Fig. 2.
SDS-PAGE analysis of conditioned media harvested from cancer cells. A, conditioned media from cancer cells were collected and processed as described under “Experimental Procedures.” Proteins (50 μg) were resolved on 8–14% gradient SDS gels and stained with Coomassie Blue. Protein bands were excised for further analysis. B, proteins (40 μg) in the conditioned media (CM) and cell extracts (CE) were analyzed via Western blotting using an anti-β-tubulin antibody.
Fig. 3.
Fig. 3.
Functional classification of proteins identified in conditioned media using ProteinCenter software based on universal GO annotation terms. The proteins were linked to at least one annotation term within the GO molecular function (A) and biological process (B) categories. The numbers represent the proteins annotated as each GO term.
Fig. 4.
Fig. 4.
Hierarchical clustering of cancer cell lines by secreted proteins. The emPAI values of all identified proteins were transformed to Z scores and analyzed via unsupervised hierarchical classification. A, hierarchical classification according to a distance tree constructed from all identified proteins. B, clustering analysis of the cell lines by 79 selected proteins, which possessed unique features used to sort the NPC cell line from others. Cell lines are shown in columns, and proteins are shown in rows. The heat map scale of Z scores ranges from −2 (green) to 4 (red) with a midpoint of 0 (black).
Fig. 5.
Fig. 5.
Biological network analysis of NPC-related proteins. The proteins in Fig. 4B were uploaded to the MetaCore mapping tool. The biological networks were generated using the analyze network algorithm. Two prominent networks involved in cell adhesion (A) and immune system regulation (B) were identified from the protein list. The concentric circles denote uploaded proteins. Nodes represent proteins with shapes representing functional class. Lines between the nodes indicate direct protein-protein interactions. Green, red, and gray lines represent stimulatory, inhibitory, or unspecified interactions, respectively. 90K, tumor-associated antigen 90K/Mac-2 binding protein; ACP1, low molecular weight phosphotyrosine protein phosphatase; APRIL/TNFSF13, a proliferation-inducing ligand/tumor necrosis factor ligand superfamily member 13; BPAG1/2, bullous pemphigoid antigen 1/2; CR1, complement component (3b/4b) receptor 1; CSF1, colony stimulating factor 1; DBL, dichaete beadex lethal; DNM1L/DRP1, dynamin 1-like protein/dynamin related protein 1; FAK1, focal adhesion kinase 1; FGF2, fibroblast growth factor 2; GA6S, galactosamine (N-acetyl)-6-sulfate sulfatase; ILK, integrin-linked protein kinase; IP-30, interferon, gamma-inducible protein 30; LAMA2/3/5, laminin subunit α-2/3/5; M-CSF, macrophage colony-stimulating factor; MMP-13, collagenase 3; PSMB4, proteasome subunit β type-4; RASGRF1, ras protein-specific guanine nucleotide-releasing factor 1; SLC3A2, solute carrier family 3, member 2; STAT1/5, signal transducer and activator of transcription 1/5; VEGFR3, vascular endothelial growth factor receptor 3; XIAP, X-linked inhibitor of apoptosis.
Fig. 6.
Fig. 6.
Validation of CD14, SDF-1, cathepsin L1, and ISG15 in serum/plasma samples. The plasma levels of CD14 (A) and SDF-1 (B) in healthy controls (Control), liver cancer patients (HCC), and lung cancer patients (LC) were measured by sandwich ELISA. The serum levels of cathepsin L1 (C) and ISG15 (D) in healthy controls (Control) and NPC patients (NPC) were detected by sandwich ELISA. Data are presented as the upper and lower quartiles and range (box), the median value (horizontal line), and the middle 90% distribution (dashed line).

Similar articles

Cited by

References

    1. Jemal A., Siegel R., Ward E., Hao Y., Xu J., Murray T., Thun M. J. (2008) Cancer statistics, 2008. CA Cancer J. Clin 58, 71–96 - PubMed
    1. Bettendorf O., Piffkò J., Bànkfalvi A. (2004) Prognostic and predictive factors in oral squamous cell cancer: important tools for planning individual therapy? Oral. Oncol 40, 110–119 - PubMed
    1. Chen Y. J., Chang J. T., Liao C. T., Wang H. M., Yen T. C., Chiu C. C., Lu Y. C., Li H. F., Cheng A. J. (2008) Head and neck cancer in the betel quid chewing area: recent advances in molecular carcinogenesis. Cancer Sci 99, 1507–1514 - PMC - PubMed
    1. Polanski M., Anderson N. L. (2007) A list of candidate cancer biomarkers for targeted proteomics. Biomark. Insights 1, 1–48 - PMC - PubMed
    1. Conrads T. P., Zhou M., Petricoin E. F., 3rd, Liotta L., Veenstra T. D. (2003) Cancer diagnosis using proteomic patterns. Expert Rev. Mol. Diagn 3, 411–420 - PubMed

MeSH terms