. 2010 Jun;9(6):1085-99.
doi: 10.1074/mcp.M900381-MCP200. Epub 2010 Feb 1.

Hypoxic tumor cell modulates its microenvironment to enhance angiogenic and metastatic potential by secretion of proteins and exosomes

Affiliations

Hypoxic tumor cell modulates its microenvironment to enhance angiogenic and metastatic potential by secretion of proteins and exosomes

Jung Eun Park et al. Mol Cell Proteomics. 2010 Jun.

Abstract

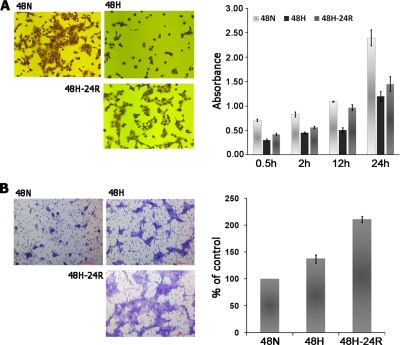
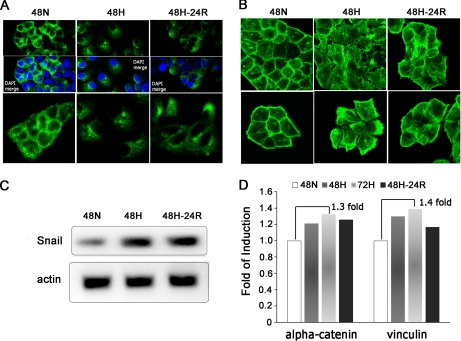
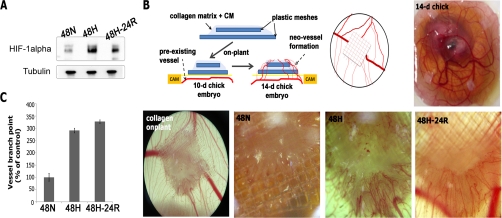
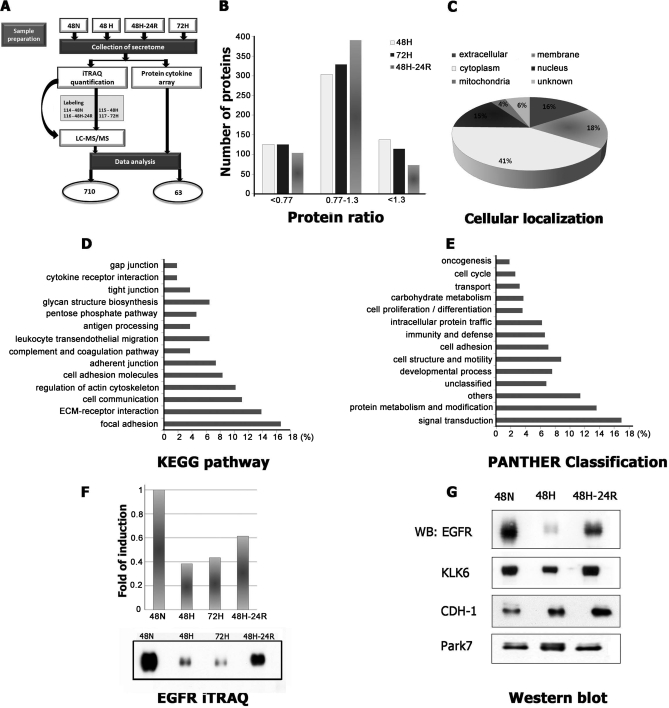
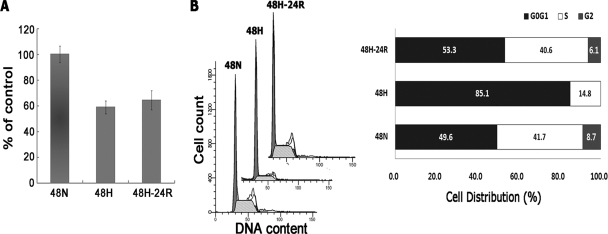
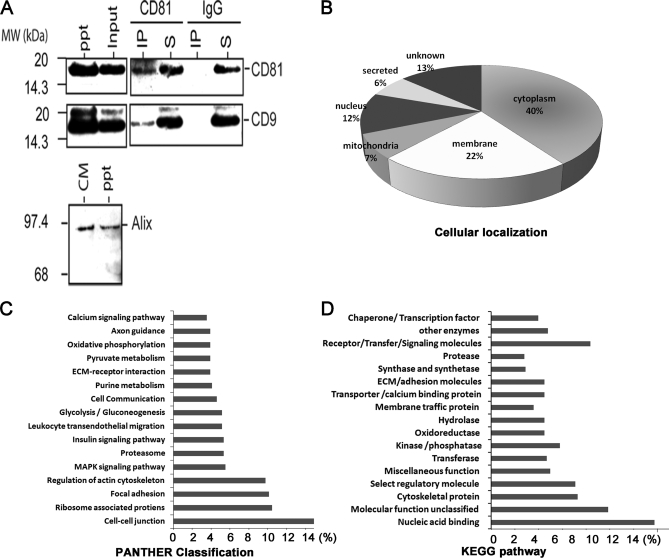
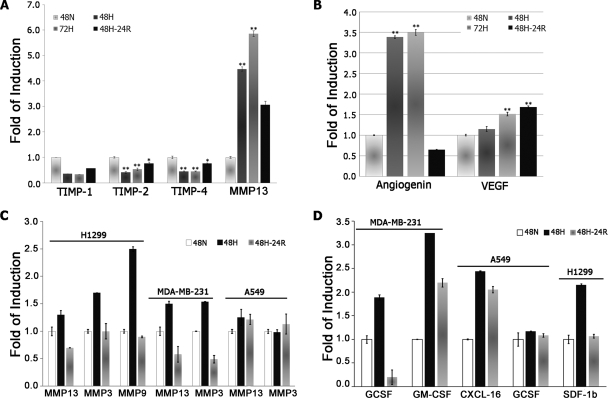
Under hypoxia, tumor cells produce a secretion that modulates their microenvironment to facilitate tumor angiogenesis and metastasis. Here, we observed that hypoxic or reoxygenated A431 carcinoma cells exhibited enhanced angiogenic and metastatic potential such as reduced cell-cell and cell-extracellular matrix adhesion, increased invasiveness, and production of a secretion with increased chorioallantoic membrane angiogenic activity. Consistent with these observations, quantitative proteomics revealed that under hypoxia the tumor cells secreted proteins involved in angiogenesis, focal adhesion, extracellular matrix-receptor interaction, and immune cell recruitment. Unexpectedly, the secreted proteins were predominantly cytoplasmic and membrane proteins. Ultracentrifugation at 100,000 x g precipitated 54% of the secreted proteins and enriched for many exosome-associated proteins such as the tetraspanins and Alix and also proteins with the potential to facilitate angiogenesis and metastasis. Two tetraspanins, CD9 and CD81, co-immunoprecipitated. Together, these data suggested that tumor cells secrete proteins and exosomes with the potential to modulate their microenvironment and facilitate angiogenesis and metastasis.


Figures

Fig. 1.
Fig. 1.
A, adhesion of A431 cells to collagen-coated culture dishes after pretreatment with either 48-h Hx or Reox. Adhesiveness was determined by seeding pretreated cells into the culture dishes and incubating the dishes for the indicated duration followed by removal of non-adherent cells. The remaining adherent cells were stained with crystal violet, and quantitation was obtained via solubilization of the dye and measuring the absorption at 595 nm. B, chemoinvasion assay of A431 cells under Hx or Reox. Cells were seeded on a porous membrane coated with a Matrigel (pseudo-ECM) layer, which assayed the ability of the cells to degrade the Matrigel and migrate to the other side of the membrane. Unmigrated cells were removed, and the remainder were stained with crystal violet. Representative images were taken at random, and quantitation was performed through cell counting in a blinded fashion. 48N, 48-h normoxia; 48H, 48-h hypoxia; 48H-24R, 48-h hypoxia followed by 24 h normoxia. Error bars denote S.D.
Fig. 2.
Fig. 2.
Hx-induced morphological changes, delocalization of E-cad, and possible dissociation of E-cad-α-catenin complexes. A, immunostaining of E-cad to visualize its localization and expression levels under the indicated conditions. Cells were counterstained with 4′,6-diamidino-2-phenylindole (DAPI) (blue). E-cadherin appears to be localized to the cell periphery under Nx (left panel), but this distribution was disrupted under Hx (middle panel) and Reox (right panel) accompanied with a concomitant drop in signal intensity. Magnification, ×63. B, visualization of F-actin via FITC-phalloidin staining. Hx and Reox appear to induce stress fiber and ruffle formation as well as an observable increase in cell size. Magnification, ×63. C, analysis of human Snail transcript levels through RT-PCR. Snail was found to be similarly up-regulated under Hx and Reox. Actin levels served as control. D, secreted levels of α-catenin and vinculin quantitated by iTRAQ analysis were found to be elevated under Hx and Reox. 48N, 48-h normoxia; 48H, 48-h hypoxia; 72H, 72-h hypoxia; 48H-24R, 48-h hypoxia followed by 24-h normoxia.
Fig. 3.
Fig. 3.
Analysis of HIF-1α levels and angiogenic potentials. A, immunoblotting against HIF-1α revealed its relative elevation under Hx and the modest decline after Reox. Tubulin was used as loading control. B, collagen onplants, with or without CM, supported by two layers of nylon mesh were randomly placed on the CAM of 10-day-old chick embryos ex ovo. Induced angiogenesis was quantitated by taking random representative images of onplants and counting the number of branch points and extent of branching of blood vessels with the aid of a dissecting microscope in a blinded fashion. C, the angiogenic index is the percentage of branch points with newly formed blood vessels relative to controls. CM from both Hx and Reox induced a marked elevation in angiogenesis of 290 and 330%, respectively. 48N, 48-h normoxia; 48H, 48-h hypoxia; 48H-24R, 48-h hypoxia followed by 24-h normoxia; WB, Western blot; d, day.
Fig. 4.
Fig. 4.
Summary of iTRAQ quantification data from A431 secretome. A, schematic overview of our quantitative analysis of the A431 secretome. B, distribution of the 710 proteins identified by mass spectrometry based on their quantities relative to the control. C, distribution of the identified proteins based on their cellular localization. Predictions were obtained from gene ontology annotation (GeneCards), computational prediction of transmembrane α helix (TMHMM), and prediction of non-classical protein secretion (SecretomeP 2.0). Ontological distribution of secreted and membrane proteins was based on the KEGG pathway database (D) and PANTHER database (E). F, comparative analysis of protein expression levels using iTRAQ and Western blot for EGFR. G, selected proteins EGFR, CDH1, KLK6, and Park7 were further analyzed by Western blot under Nx, Hx, and Reox for validation of iTRAQ data. 48N, 48-h normoxia; 48H, 48-h hypoxia; 48H-24R, 48-h hypoxia followed by 24-h normoxia; WB, Western blot.
Fig. 5.
Fig. 5.
Effects of Hx and Reox on A431 cell proliferation and cell cycle arrest. A, cells were subjected to the indicated conditions, and proliferation was subsequently analyzed via the 3-(4,5-dimethylthiazol-2-yl)-2,5-diphenyltetrazolium bromide assay. Cell proliferation was found to be suppressed by both Hx and Reox treatments but to a lesser extent in the latter case. B, induction of cell cycle arrest in G0G1 phase by Hx. Cells were treated with the fluorescent dye propidium iodide, and measurements of DNA content were performed via flow cytometry. The distribution of cells based on cell cycle stage is shown. Hx induced severe arrest in G0G1 phase that was released by Reox, evidenced by cells entering both S and G2 phases. 48N, 48-h normoxia; 48H, 48-h hypoxia; 48H-24R, 48-h hypoxia followed by 24-h normoxia.
Fig. 6.
Fig. 6.
A, co-immunoprecipitation of CD81 and CD9. After immunoprecipitation of CM with anti-CD81 or mouse IgG, the immunoprecipitate (IP) and supernatant (S) were analyzed by Western blot hybridization using antibodies against CD81 and CD9. Western blotting using the 200,000 × g precipitate (ppt; exosome fraction) showed that the size and density of the CD81-CD9 complex in the CM were consistent with that of an exosome. A Western blot analysis of Alix using the CM and exosome fraction (ppt) is shown. B–D, summary of LC-MS data from the A431 exosome. B, distribution of the identified proteins based on their cellular localization. Predictions were obtained from gene ontology annotation (GeneCards), computational prediction of transmembrane α helix (TMHMM), and prediction of non-classical protein secretion (SecretomeP 2.0). The ontological distribution of secreted and membrane proteins was based on the KEGG pathway database (C) and PANTHER database (D). MAPK, mitogen-activated protein kinase.
Fig. 7.
Fig. 7.
A, relative quantities of the secreted MMP-13-TIMP proteolytic system components, MMP-13 and TIMP-1, -2, and -4, determined by cytokine arrays. MMP-13 secretion was found to be elevated by 450, 585, and 300% by 48-h Hx, 72-h Hx, and Reox, respectively, whereas TIMP levels wersuppressed under both Hx and Reox. B, relative levels of secreted ANG and VEGF as determined by cytokine array. Both were significantly elevated under Hx, but ANG dropped precipitously to 65% of control under Reox, whereas secreted VEGF levels increased further. Statistical significance was accepted at p < 0.05 (*) and p < 0.01 (**). C, relative quantities of the secreted MMPs in MDA-MB-231, A549, and H1299 cells determined by cytokine arrays. MMP-3, -9, and -13 secretion was found to be elevated under 72-h Hx. D, relative levels of secreted chemokines related to recruitment of immune cells, G-CSF, GM-CSF, CXCL-16, and stroma-derived factor-1 (SDF-1beta), as determined by cytokine array. Secretion of these chemokines was significantly elevated under Hx. 48N, 48-h normoxia; 48H, 48-h hypoxia; 48H-24R, 48-h hypoxia followed by 24-h normoxia.

Similar articles

Cited by

References

    1. Hanahan D., Weinberg R. A. (2000) The hallmarks of cancer. Cell 100, 57–70 - PubMed
    1. Stacker S. A., Baldwin M. E., Achen M. G. (2002) The role of tumor lymphangiogenesis in metastatic spread. FASEB J 16, 922–934 - PubMed
    1. Sporn M. B. (1997) The war on cancer: a review. Ann. N.Y. Acad. Sci 833, 137–146 - PubMed
    1. Ferrara N., Hillan K. J., Novotny W. (2005) Bevacizumab (Avastin), a humanized anti-VEGF monoclonal antibody for cancer therapy. Biochem. Biophys. Res. Commun 333, 328–335 - PubMed
    1. Bergers G., Hanahan D. (2008) Modes of resistance to anti-angiogenic therapy. Nat. Rev. Cancer 8, 592–603 - PMC - PubMed

Publication types

MeSH terms