

Sub-part-per-million precursor and product mass accuracy for high-throughput proteomics on an electron transfer dissociation-enabled orbitrap mass spectrometer
- PMID: 20124352
- PMCID: PMC2871411
- DOI: 10.1074/mcp.M900541-MCP200
Sub-part-per-million precursor and product mass accuracy for high-throughput proteomics on an electron transfer dissociation-enabled orbitrap mass spectrometer
Abstract
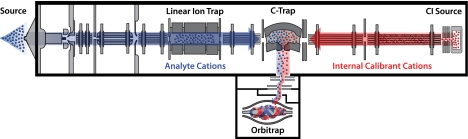
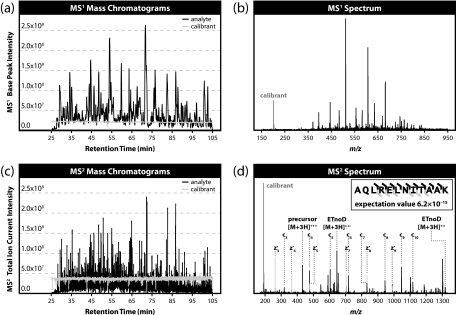
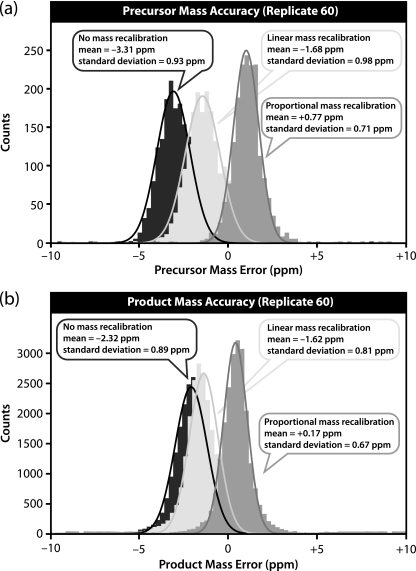
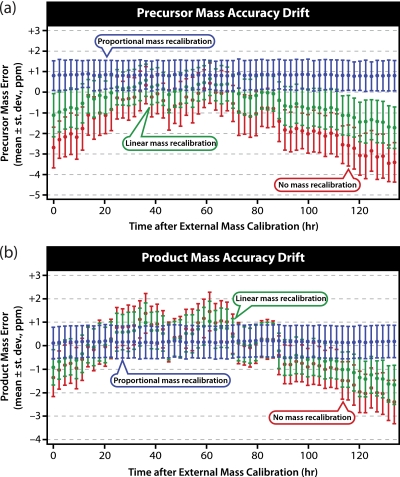
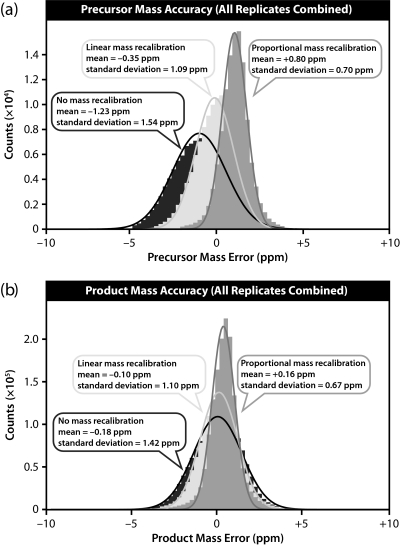
We demonstrate a new approach for internal mass calibration on an electron transfer dissociation-enabled linear ion trap-orbitrap hybrid mass spectrometer. Fluoranthene cations, a byproduct of the reaction used for generation of electron transfer dissociation reagent anions, are co-injected with the analyte cations in all orbitrap mass analysis events. The fluoranthene cations serve as a robust internal calibrant with minimal impact on scan time (<20 ms) or spectral quality. Following external mass calibration, 60 replicate LC-MS/MS runs of a complex peptide mixture were collected over the course of approximately 136 h (almost 6 days). Using only standard external mass calibration, the mass accuracy for a typical analysis was -3.31 +/- 0.93 ppm (sigma) for precursors and -2.32 +/- 0.89 ppm for products. After application of internal recalibration, mass accuracy improved to +0.77 +/- 0.71 ppm for precursors and +0.17 +/- 0.67 ppm for products. When all 60 replicate runs were analyzed together without internal mass recalibration, the mass accuracy was -1.23 +/- 1.54 ppm for precursors and -0.18 +/- 1.42 ppm for products, nearly a 2-fold drop in precision relative to an individual run. After internal mass recalibration, this improved to +0.80 +/- 0.70 ppm for precursors and +0.16 +/- 0.67 ppm for products, roughly equivalent to that obtained in a single run, demonstrating a near complete elimination of mass calibration drift.
Figures
References
-
- Zubarev R., Mann M. (2007) On the proper use of mass accuracy in proteomics. Mol. Cell. Proteomics 6, 377–381 - PubMed
-
- Syka J. E., Marto J. A., Bai D. L., Horning S., Senko M. W., Schwartz J. C., Ueberheide B., Garcia B., Busby S., Muratore T., Shabanowitz J., Hunt D. F. (2004) Novel linear quadrupole ion trap/FT mass spectrometer: Performance characterization and use in the comparative analysis of histone H3 post-translational modifications. J. Proteome Res 3, 621–626 - PubMed
-
- Makarov A., Denisov E., Kholomeev A., Balschun W., Lange O., Strupat K., Horning S. (2006) Performance evaluation of a hybrid linear ion trap/orbitrap mass spectrometer. Anal. Chem 78, 2113–2120 - PubMed
-
- Jeffries J. B., Barlow S. E., Dunn G. H. (1983) Theory of space-charge shift of ion-cyclotron resonance frequencies. Int. J. Mass Spectrom 54, 169–187
-
- Francl T. J., Sherman M. G., Hunter R. L., Locke M. J., Bowers W. D., Mciver R. T. (1983) Experimental determination of the effects of space charge on ion cyclotron resonance frequencies. Int. J. Mass Spectrom 54, 189–199
Publication types
MeSH terms
Substances
Grants and funding
LinkOut - more resources
Full Text Sources
Other Literature Sources
