

Inorganic polyphosphate and energy metabolism in mammalian cells
- PMID: 20124409
- PMCID: PMC2843191
- DOI: 10.1074/jbc.M109.013011
Inorganic polyphosphate and energy metabolism in mammalian cells
Abstract
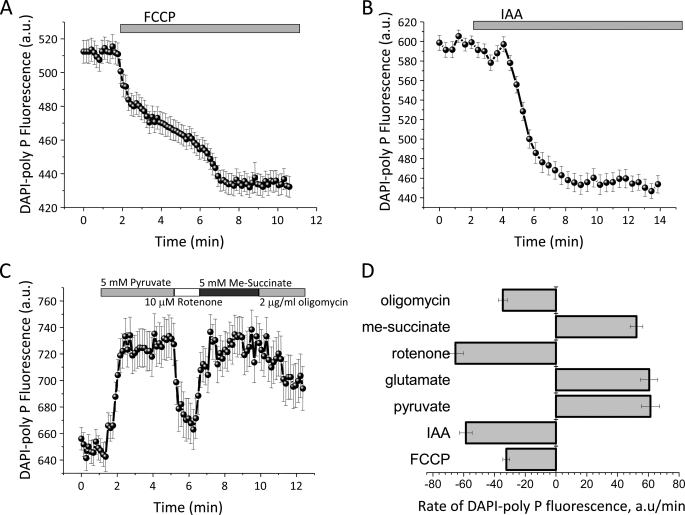
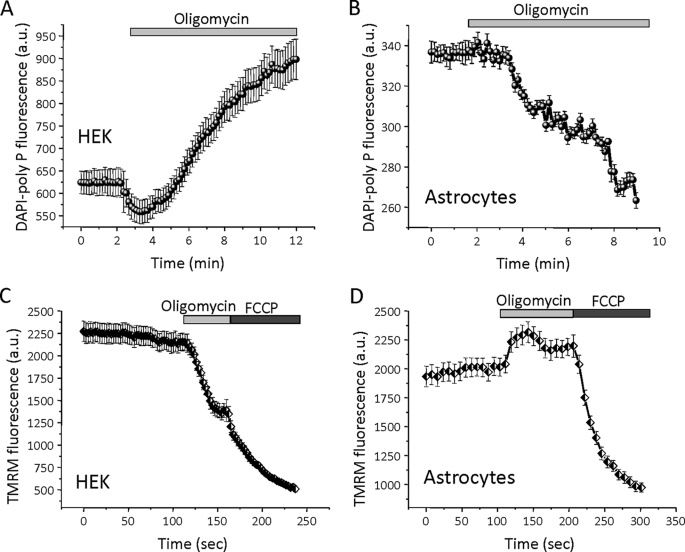
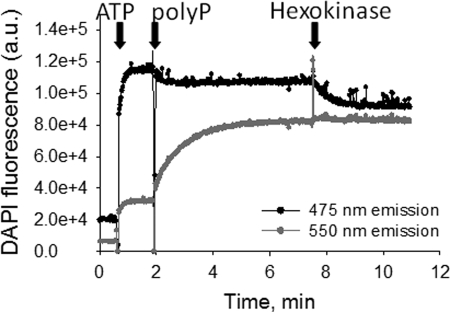
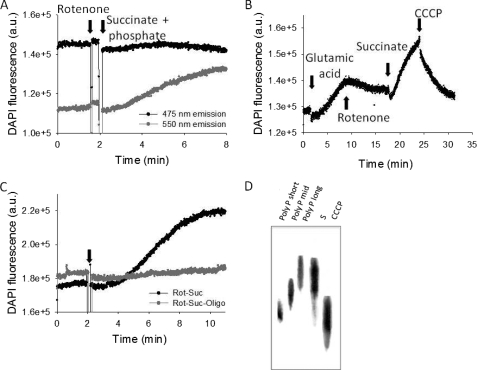
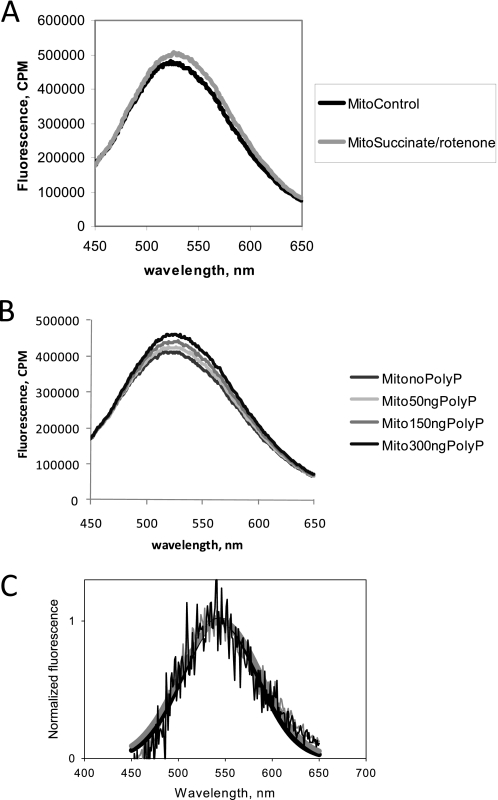
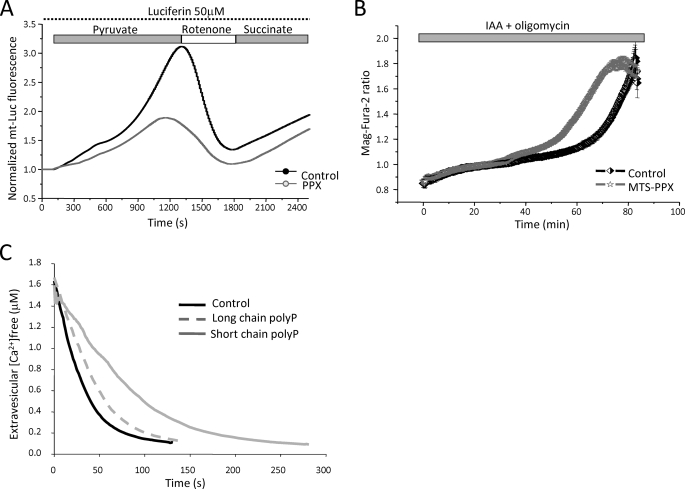
Inorganic polyphosphate (poly P) is a polymer made from as few as 10 to several hundred phosphate molecules linked by phosphoanhydride bonds similar to ATP. Poly P is ubiquitous in all mammalian organisms, where it plays multiple physiological roles. The metabolism of poly P in mammalian organisms is not well understood. We have examined the mechanism of poly P production and the role of this polymer in cell energy metabolism. Poly P levels in mitochondria and intact cells were estimated using a fluorescent molecular probe, 4',6-diamidino-2-phenylindole. Poly P levels were dependent on the metabolic state of the mitochondria. Poly P levels were increased by substrates of respiration and in turn reduced by mitochondrial inhibitor (rotenone) or an uncoupler (carbonyl cyanide p-trifluoromethoxyphenylhydrazone). Oligomycin, an inhibitor of mitochondrial ATP-synthase, blocked the production of poly P. Enzymatic depletion of poly P from cells significantly altered the rate of ATP metabolism. We propose the existence of a feedback mechanism where poly P production and cell energy metabolism regulate each other.
Figures
Similar articles
-
Inorganic polyphosphate is produced and hydrolyzed in F0F1-ATP synthase of mammalian mitochondria.Biochem J. 2020 Apr 30;477(8):1515-1524. doi: 10.1042/BCJ20200042. Biochem J. 2020. PMID: 32270854 Free PMC article.
-
Depletion of mitochondrial inorganic polyphosphate (polyP) in mammalian cells causes metabolic shift from oxidative phosphorylation to glycolysis.Biochem J. 2021 Apr 30;478(8):1631-1646. doi: 10.1042/BCJ20200975. Biochem J. 2021. PMID: 33843973 Free PMC article.
-
Contributions of glycolysis and oxidative phosphorylation to adenosine 5'-triphosphate production in AS-30D hepatoma cells.Cancer Res. 1984 Dec;44(12 Pt 1):5702-6. Cancer Res. 1984. PMID: 6498833
-
Polyphosphate as a metabolic fuel in Metazoa: A foundational breakthrough invention for biomedical applications.Biotechnol J. 2016 Jan;11(1):11-30. doi: 10.1002/biot.201500168. Epub 2015 Sep 10. Biotechnol J. 2016. PMID: 26356505 Review.
-
Inorganic polyphosphate in cardiac myocytes: from bioenergetics to the permeability transition pore and cell survival.Biochem Soc Trans. 2016 Feb;44(1):25-34. doi: 10.1042/BST20150218. Biochem Soc Trans. 2016. PMID: 26862184 Review.
Cited by
-
An alternative role of FoF1-ATP synthase in Escherichia coli: synthesis of thiamine triphosphate.Sci Rep. 2013;3:1071. doi: 10.1038/srep01071. Epub 2013 Jan 15. Sci Rep. 2013. PMID: 23323214 Free PMC article.
-
The dynamic relationship between inorganic polyphosphate and adenosine triphosphate in human non-small cell lung cancer H1299 cells.FEBS Open Bio. 2024 Feb;14(2):344-354. doi: 10.1002/2211-5463.13753. Epub 2024 Jan 1. FEBS Open Bio. 2024. PMID: 38105501 Free PMC article.
-
Importance of polyphosphate in the Leishmania life cycle.Microb Cell. 2018 Jun 22;5(8):371-384. doi: 10.15698/mic2018.08.642. Microb Cell. 2018. PMID: 30175107 Free PMC article.
-
Skin Minerals: Key Roles of Inorganic Elements in Skin Physiological Functions.Int J Mol Sci. 2022 Jun 3;23(11):6267. doi: 10.3390/ijms23116267. Int J Mol Sci. 2022. PMID: 35682946 Free PMC article. Review.
-
Mast cells co-expressing CD68 and inorganic polyphosphate are linked with colorectal cancer.PLoS One. 2018 Mar 15;13(3):e0193089. doi: 10.1371/journal.pone.0193089. eCollection 2018. PLoS One. 2018. PMID: 29543850 Free PMC article.
References
-
- Kornberg A., Rao N. N., Ault-Riché D. (1999) Annu. Rev. Biochem. 68, 89–125 - PubMed
-
- Beauvoit B., Rigoulet M., Raffard G., Canioni P., Guérin B. (1991) Biochemistry 30, 11212–11220 - PubMed
-
- Akiyama M., Crooke E., Kornberg A. (1993) J. Biol. Chem. 268, 633–639 - PubMed
-
- Kulaev I., Vagabov V., Kulakovskaya T. (1999) J. Biosci. Bioeng. 88, 111–129 - PubMed
Publication types
MeSH terms
Substances
LinkOut - more resources
Full Text Sources
