

The RNA helicase DHH1 is central to the correct expression of many developmentally regulated mRNAs in trypanosomes
- PMID: 20124414
- PMCID: PMC2823576
- DOI: 10.1242/jcs.058511
The RNA helicase DHH1 is central to the correct expression of many developmentally regulated mRNAs in trypanosomes
Abstract
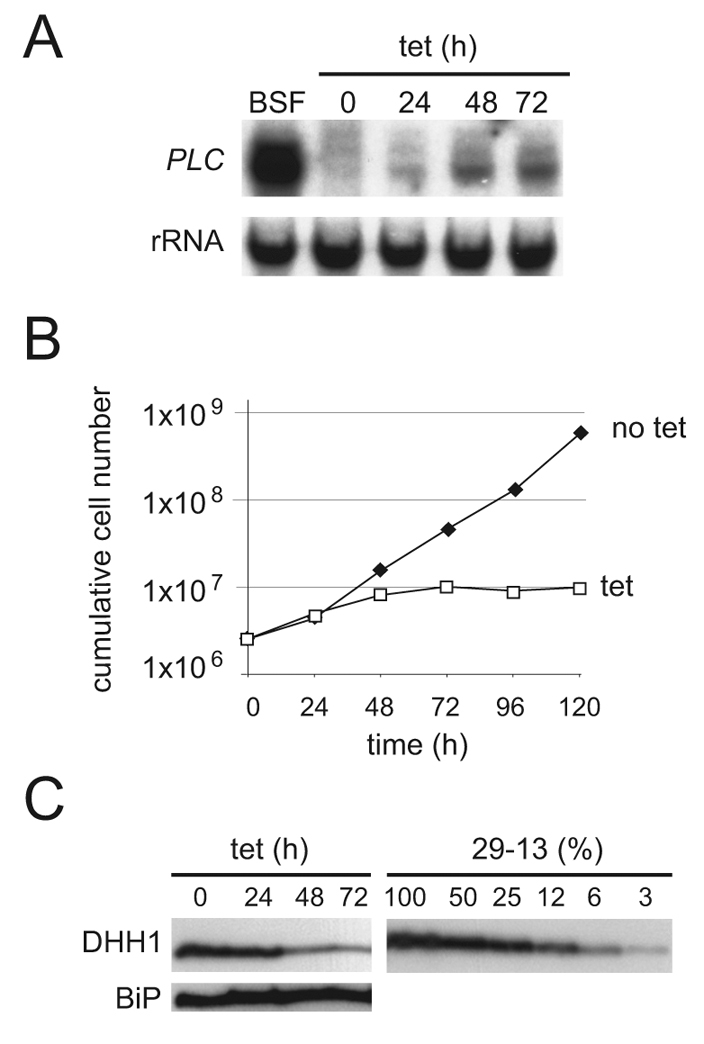
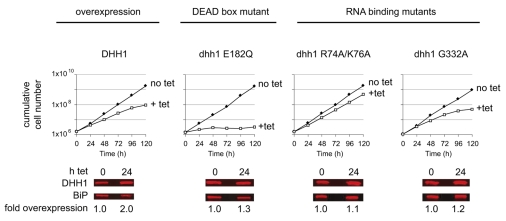
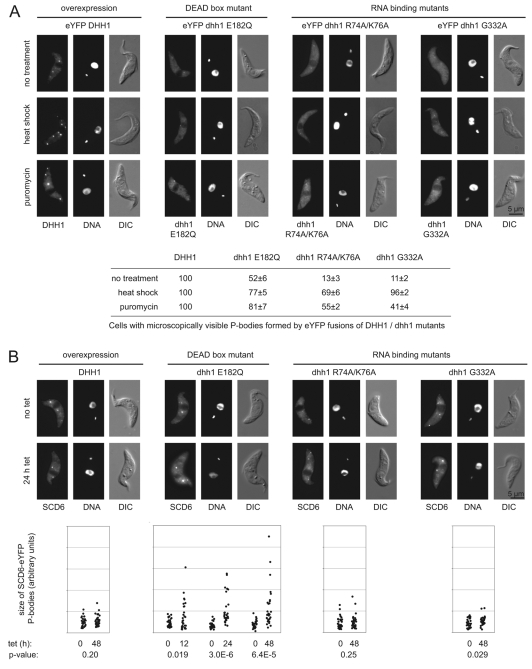
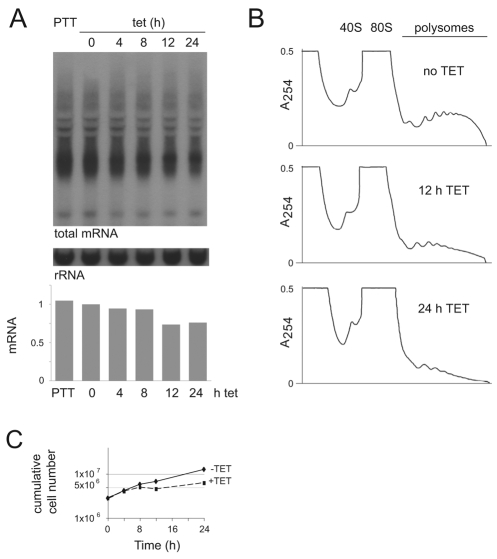
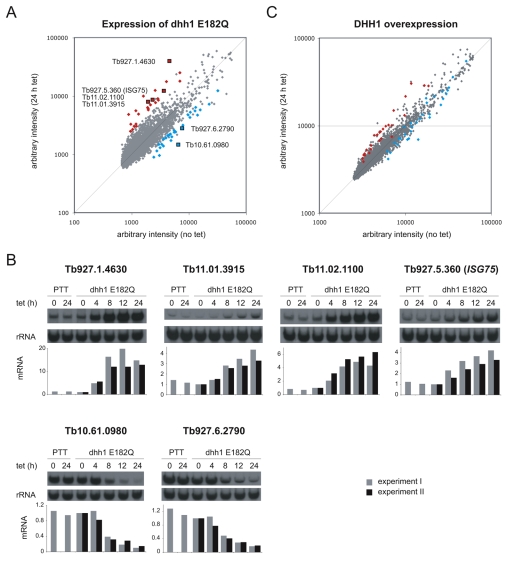
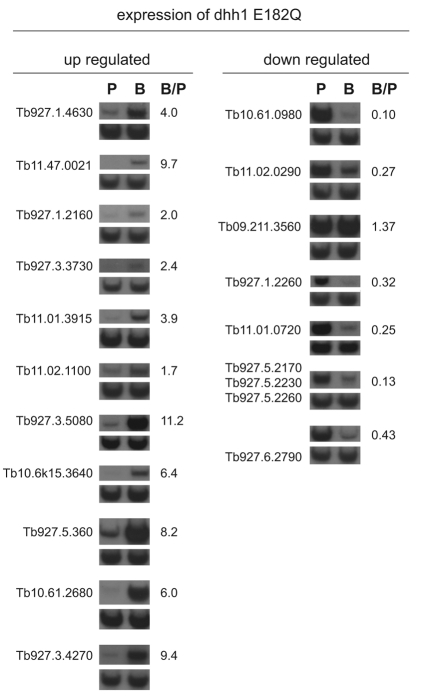
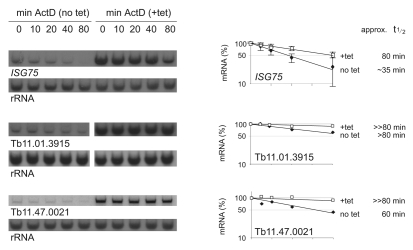
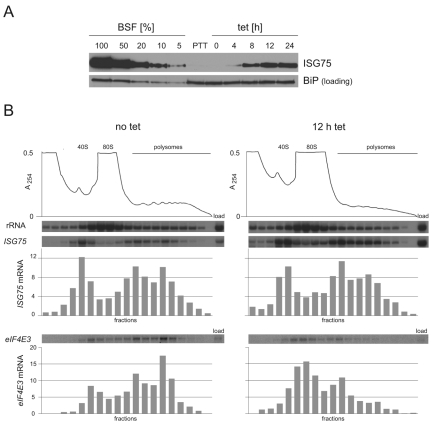
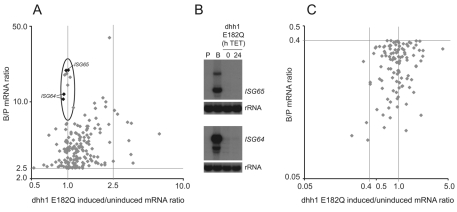
In trypanosomes, the predominant mechanisms of regulation of gene expression are post-transcriptional. The DEAD-box RNA helicase DHH1 was identified in a screen for gene products that are necessary for the instability of the GPI-PLC mRNA in insect-stage trypanosomes. Expression of an ATPase-deficient dhh1 mutant caused a rapid growth arrest associated with a decrease in polysomes, an increase in P-bodies and a slight decrease in average mRNA levels. However, the effect of dhh1 mutant expression on both turnover and translational repression of mRNAs was selective. Whereas there was little effect on the stability of constitutive mRNAs, the control of a large cohort of developmentally regulated mRNAs was reversed; many mRNAs normally downregulated in insect-stage trypanosomes were stabilized and many mRNAs normally upregulated decreased in level. One stabilised mRNA, ISG75, was characterised further. Despite the overall decrease in polysomes, the proportion of the ISG75 mRNA in polysomes was unchanged and the result was ISG75 protein accumulation. Our data show that specific mRNAs can escape DHH1-mediated translational repression. In trypanosomes, DHH1 has a selective role in determining the levels of developmentally regulated mRNAs.
Figures
Similar articles
-
An AU-rich instability element in the 3'UTR mediates an increase in mRNA stability in response to expression of a dhh1 ATPase mutant.Translation (Austin). 2014 Apr 9;2(1):e28587. doi: 10.4161/trla.28587. eCollection 2014. Translation (Austin). 2014. PMID: 26779405 Free PMC article.
-
Role of the DHH1 gene in the regulation of monocarboxylic acids transporters expression in Saccharomyces cerevisiae.PLoS One. 2014 Nov 3;9(11):e111589. doi: 10.1371/journal.pone.0111589. eCollection 2014. PLoS One. 2014. PMID: 25365506 Free PMC article.
-
Developmentally regulated instability of the GPI-PLC mRNA is dependent on a short-lived protein factor.Nucleic Acids Res. 2005 Mar 8;33(5):1503-12. doi: 10.1093/nar/gki298. Print 2005. Nucleic Acids Res. 2005. PMID: 15755751 Free PMC article.
-
The DHH1/RCKp54 family of helicases: an ancient family of proteins that promote translational silencing.Biochim Biophys Acta. 2013 Aug;1829(8):817-23. doi: 10.1016/j.bbagrm.2013.03.006. Epub 2013 Mar 23. Biochim Biophys Acta. 2013. PMID: 23528737 Free PMC article. Review.
-
Mitochondrial RNA editing in trypanosomes: small RNAs in control.Biochimie. 2014 May;100:125-31. doi: 10.1016/j.biochi.2014.01.003. Epub 2014 Jan 17. Biochimie. 2014. PMID: 24440637 Free PMC article. Review.
Cited by
-
Characterization of an Atypical eIF4E Ortholog in Leishmania, LeishIF4E-6.Int J Mol Sci. 2021 Nov 24;22(23):12720. doi: 10.3390/ijms222312720. Int J Mol Sci. 2021. PMID: 34884522 Free PMC article.
-
The CAF1-NOT complex of trypanosomes.Front Genet. 2014 Jan 2;4:299. doi: 10.3389/fgene.2013.00299. Front Genet. 2014. PMID: 24427169 Free PMC article. Review.
-
Inhibition of mRNA maturation in trypanosomes causes the formation of novel foci at the nuclear periphery containing cytoplasmic regulators of mRNA fate.J Cell Sci. 2012 Jun 15;125(Pt 12):2896-909. doi: 10.1242/jcs.099275. Epub 2012 Feb 24. J Cell Sci. 2012. PMID: 22366449 Free PMC article.
-
Arginine methylation of DRBD18 differentially impacts its opposing effects on the trypanosome transcriptome.Nucleic Acids Res. 2015 Jun 23;43(11):5501-23. doi: 10.1093/nar/gkv428. Epub 2015 May 4. Nucleic Acids Res. 2015. PMID: 25940618 Free PMC article.
-
SCD6 induces ribonucleoprotein granule formation in trypanosomes in a translation-independent manner, regulated by its Lsm and RGG domains.Mol Biol Cell. 2013 Jul;24(13):2098-111. doi: 10.1091/mbc.E13-01-0068. Epub 2013 May 15. Mol Biol Cell. 2013. PMID: 23676662 Free PMC article.
References
-
- Archer S., Queiroz R., Stewart M., Clayton C. (2008). Trypanosomes as a model to investigate mRNA decay pathways. Methods Enzymol. 448, 359-377 - PubMed
-
- Bangs J. D., Uyetake L., Brickman M. J., Balber A. E., Boothroyd J. C. (1993). Molecular cloning and cellular localization of a BiP homologue in Trypanosoma brucei. Divergent ER retention signals in a lower eukaryote. J. Cell Sci. 105, 1101-1113 - PubMed
-
- Bhattacharyya S. N., Habermacher R., Martine U., Closs E. I., Filipowicz W. (2006). Stress-induced reversal of microRNA repression and mRNA P-body localization in human cells. Cold Spring Harb. Symp. Quant. Biol. 71, 513-521 - PubMed
-
- Blattner J., Clayton C. E. (1995). The 3′-untranslated regions from the Trypanosoma brucei phosphoglycerate kinase-encoding genes mediate developmental regulation. Gene 162, 153-156 - PubMed
Publication types
MeSH terms
Substances
Grants and funding
LinkOut - more resources
Full Text Sources
Molecular Biology Databases
