. 2010 Feb;9(2):257-67.
doi: 10.1158/1535-7163.MCT-09-0743. Epub 2010 Feb 2.

Integrative analysis of proteomic signatures, mutations, and drug responsiveness in the NCI 60 cancer cell line set

Affiliations

Integrative analysis of proteomic signatures, mutations, and drug responsiveness in the NCI 60 cancer cell line set

Eun Sung Park et al. Mol Cancer Ther. 2010 Feb.

Abstract

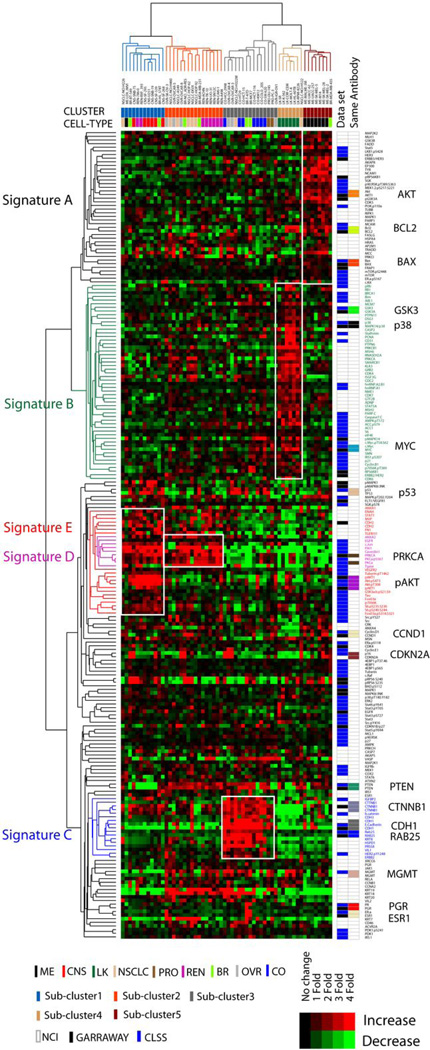
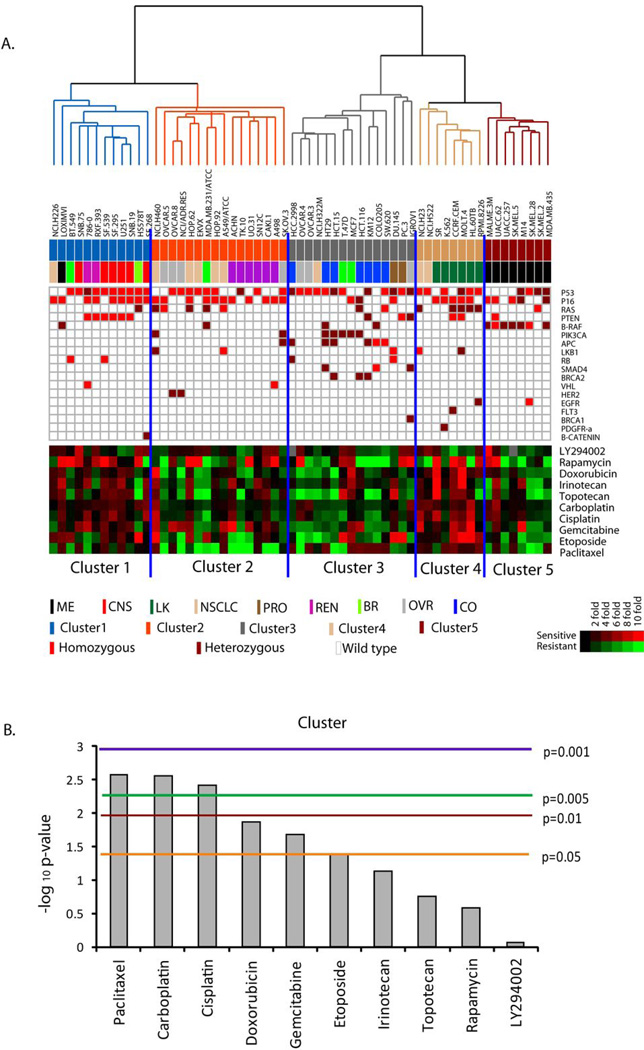
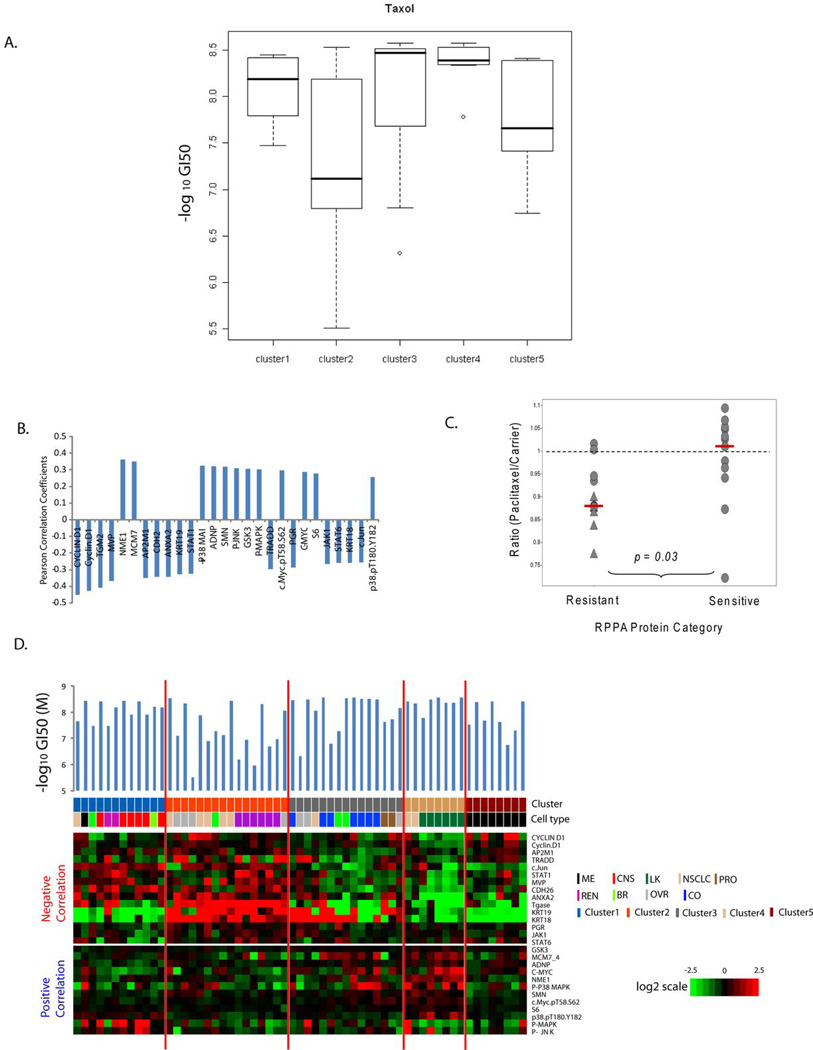
Aberrations in oncogenes and tumor suppressors frequently affect the activity of critical signal transduction pathways. To analyze systematically the relationship between the activation status of protein networks and other characteristics of cancer cells, we did reverse phase protein array (RPPA) profiling of the NCI60 cell lines for total protein expression and activation-specific markers of critical signaling pathways. To extend the scope of the study, we merged those data with previously published RPPA results for the NCI60. Integrative analysis of the expanded RPPA data set revealed five major clusters of cell lines and five principal proteomic signatures. Comparison of mutations in the NCI60 cell lines with patterns of protein expression showed significant associations for PTEN, PIK3CA, BRAF, and APC mutations with proteomic clusters. PIK3CA and PTEN mutation enrichment were not cell lineage-specific but were associated with dominant yet distinct groups of proteins. The five RPPA-defined clusters were strongly associated with sensitivity to standard anticancer agents. RPPA analysis identified 27 protein features significantly associated with sensitivity to paclitaxel. The functional status of those proteins was interrogated in a paclitaxel whole genome small interfering RNA (siRNA) library synthetic lethality screen and confirmed the predicted associations with drug sensitivity. These studies expand our understanding of the activation status of protein networks in the NCI60 cancer cell lines, demonstrate the importance of the direct study of protein expression and activation, and provide a basis for further studies integrating the information with other molecular and pharmacological characteristics of cancer.


Figures

Figure 1
Figure 1
RPPA analysis of the NCI 60 RPPA cell lines and tumor types. Unsupervised hierarchical clustering analysis of the integrated proteomic data representing 222 protein features (167 unique features) from 3 independent NCI60 RPPA data sets is shown. The RPPA data sets were independently normalized and mean centered before integration. Categorization of the cells into one of 5 clusters is indicated by “CLUSTER” below the cell line names. The cancer cell type from which each cell line originated is indicated by “CELL-TYPE” below the color-coded label for “CLUSTER.” The groups of proteins that demonstrate increased expression characteristic of the different cell line clusters are indicated to the left (“Signature A – E”). The RPPA data set source for each protein is indicated to the right of the heatmap. Proteins assessed in more than one data set are also indicated (“Same Antibody”).
Figure 2
Figure 2
Association of the NCI60 RPPA signatures with mutations and drug sensitivity. (A) Cell lines are organized by the results of unsupervised clustering analysis of the RPPA data (Figure 1). RPPA cluster and the cell type are indicated below the cell line labels. Mutations identified in each cell line are indicated in the table below (Homozygous mutations = orange squares; Heterozygous mutations = brown squares). The heatmap represents the negative log10 GI50 values of 10 standard anti-cancer agents. GI50 values were median-centered (Red = high value, i.e. sensitive; Green = low value, i.e. resistant). (B) Results of 5 group one-way ANOVA analysis of the GI50 values for each of the agents for the NCI60 cell lines. Y-axis, negative log 10 p-values. The colored horizontal lines indicate various p-value cutoffs.
Figure 3
Figure 3
Protein factors associated with paclitaxel responsiveness in the NCI60 panel. (A). Box-plot analysis of negative log10 GI50 values for paclitaxel in each RPPA-defined cluster. (B) Pearson correlation coefficients for proteins significantly correlated with paclitaxel response across the NCI 60 cell lines (p-values for the Pearson correlation < 0.05). Positive values indicate that high expression is associated with high sensitivity; negative values reflect association with paclitaxel resistance. (C) Effect of proteins significantly associated with paclitaxel sensitivity on relative growth of lung cancer cells in the presence of paclitaxel. The results of a previously published whole genome siRNA library +/− paclitaxel synthetic lethality screen (28) were reviewed. Y-axis, ratio of relative growth for cells in the presence of siRNA with paclitaxel to siRNA with vehicle. The dotted line indicates Paclitaxel/Carrier ratio of 1. The red bars indicate the median of each group. ▲, significant difference (p < 0.05) for growth in the presence of paclitaxel versus carrier. (D) Expression of proteins significantly correlating with paclitaxel GI50 values in the NCI60. Cells are organized by the results of unsupervised hierarchical clustering of the RPPA data (Figure 1). Heat maps show protein expression levels negatively (upper panel) and positively (lower panel) correlated with sensitivity. The RPPA cluster and cell type for each cell line are indicated. The –Log10 GI50 value for paclitaxel for each cell line is presented above the heatmap.

References

    1. Shoemaker RH. The NCI60 human tumour cell line anticancer drug screen. Nat Rev Cancer. 2006;6:813–823. - PubMed
    1. Blower PE, Verducci JS, Lin S, et al. MicroRNA expression profiles for the NCI-60 cancer cell panel. Mol Cancer Ther. 2007;6:1483–1491. - PubMed
    1. Bussey KJ, Chin K, Lababidi S, et al. Integrating data on DNA copy number with gene expression levels and drug sensitivities in the NCI-60 cell line panel. Mol Cancer Ther. 2006;5:853–867. - PMC - PubMed
    1. Ehrich M, Turner J, Gibbs P, et al. Cytosine methylation profiling of cancer cell lines. Proc Natl Acad Sci U S A. 2008;105:4844–4849. - PMC - PubMed
    1. Gaur A, Jewell DA, Liang Y, et al. Characterization of microRNA expression levels and their biological correlates in human cancer cell lines. Cancer Res. 2007;67:2456–2468. - PubMed

Publication types

Substances