. 2010 Feb 15;70(4):1286-95.
doi: 10.1158/0008-5472.CAN-09-2509. Epub 2010 Feb 2.

Variability in the androgen response of prostate epithelium to 5alpha-reductase inhibition: implications for prostate cancer chemoprevention

Affiliations

Variability in the androgen response of prostate epithelium to 5alpha-reductase inhibition: implications for prostate cancer chemoprevention

Elahe A Mostaghel et al. Cancer Res. .

Abstract

Inhibitors of 5alpha-reductase (SRD5A) that lower intraprostatic levels of dihydrotestosterone (DHT) reduce the overall incidence of prostate cancer (PCa), but there is significant variation in chemopreventive activity between individual men. In seeking molecular alterations that might underlie this variation, we compared gene expression patterns in patients with localized PCa who were randomized to prostatectomy alone versus treatment with two different doses of the SRD5A inhibitor dutasteride. Prostatic levels of DHT were decreased by >90% in both dutasteride-treated patient groups versus the untreated patient group. Despite significant and uniform suppression of tissue DHT, unsupervised clustering based on prostatic gene expression did not discriminate these groups. However, subjects could be resolved into distinct cohorts characterized by high or low expression of genes regulated by the androgen receptor (AR), based solely on AR transcript expression. The higher-dose dutasteride treatment group was found to include significantly fewer cancers with TMPRSS2-ERG genetic fusions. Dutasteride treatment was associated with highly variable alterations in benign epithelial gene expression. Segregating subjects based on expression of AR and androgen-regulated genes revealed that patients are differentially sensitive to SRD5A inhibition. Our findings suggest that AR levels may predict the chemopreventive efficacy of SRD5A inhibitors.


Figures

Figure 1
Figure 1. Unsupervised clustering of untreated and dutasteride-treated samples based on prostate epithelial gene expression
Samples from patients undergoing surgery alone (black squares) or treated with 0.5 or 3.5 mg dutasteride (white and gray squares) were ordered based on unsupervised clustering using the 1000 most variably expressed genes. Dendrograms depict relationship of all samples (a) or dutasteride-treated samples (b).
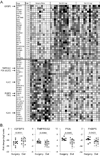
Figure 2
Figure 2. Differential gene expression in microdissected prostate epithelium from untreated and dutasteride-treated patients
(a) The top 60 up or down-regulated genes identified in a supervised two-sample t test between untreated (surgery alone) and combined dutasteride-treated samples (≥1.75 fold, FDR <5%). The full list of 120 genes differentially regulated by ≥1.5 fold is provided in Supp. 3. Grey scale represents genes with lower expression as white, no change as grey and higher expression as black. (b) Confirmation of microarray data by qRT-PCR of indicated genes. Y-axis is fold change in expression (relative to RPL13A). Horizontal bars indicate mean values. Two sample t-tests were used to compare difference in mean cycle thresholds between untreated (Surgery) and dutasteride-treated (Dut) samples with p values as depicted. (Black circles untreated samples, white circles 0.5mg Dut, and grey circles 3.5mg Dut.)
Figure 3
Figure 3. Unsupervised clustering of dutasteride-treated samples based on expression of androgen-regulated genes
Benign prostate epithelial samples from dutasteride patients (white squares 0.5mg; gray squares 3.5 mg) were ordered based on unsupervised hierarchical clustering using 90 androgen-regulated genes. (a) The dutasteride-treated samples segregated into two groups based on low expression of androgen-regulated genes (ARG-Lo; green shaded portion of heat map) vs. higher expression of androgen-regulated genes (ARG-Hi; red shaded). Depicted is a node containing a subset of 90 androgen-regulated genes used to perform clustering. (b) Unsupervised clustering of entire sample set (including untreated cases, black squares) using the same 90 androgen-regulated genes. (c) Surgery Alone and dutasteride-treated samples were separately ordered based on AR transcript expression level (microarray data, red denotes higher and green lower expression). Dutasteride treatment and whether each sample was designated as high (ARG-Hi) or low (ARG-Lo) for expression of androgen-regulated genes from the cluster analysis in (a) is indicated. Crosshatching denotes the one sample with lower AR transcript expression that was assigned to ARG-Hi in the cluster analysis.
Figure 4
Figure 4. Comparison of androgen responsive gene status with AR transcript abundance
(a) Dot plots showing expression of indicated genes by qRT-PCR in Surgery alone and dutasteride-treated groups; designation of dutasteride-treated samples into ARG-Hi and ARG-Lo is based on clustering of microarray data in Figure 3(a). (Black circles untreated samples; white circles 0.5mg Dut; grey circles 3.5mg Dut.) (b) The linear regression of AR transcript expression with that of PSA (squares; slope = 0.4203) and TMPRSS2 (triangles; slope = 0.5442) by qRT-PCR.
Figure 5
Figure 5. Analysis of TFF3 and TMPRSS2 expression in neoplastic prostate epithelium
TFF3 and TMPRSS2 expression was evaluated using a TMA comprising triplicate benign and cancer cores per patient. Staining was scored on a 4-point scale from none (0) to high (3). The distribution of cores in each treatment group displaying no (0), low (1), moderate (2) or high (3) intensity staining is shown for TFF3 (a) and TMPRSS2 (b). Staining intensity in control and treatment groups was compared using a logistic regression model to account for multiple observations per patient, with statistically significant changes indicated (*). Decreases in TFF3 staining were significant in the benign tissue (Dut 3.5 group; p <50.01), and for TMPRSS2 in the benign (Dut 3.5 group; p= 0.03) and cancer tissue (Dut 0.5; p=0.04 and Dut 3.5; p=0.02). Representative images (20x) showing TFF3 and TMPRSS2 staining in benign untreated (surgery alone) and dutasteride-treated cores (c).

References

    1. Nelson PS, Clegg N, Arnold H, et al. The program of androgen-responsive genes in neoplastic prostate epithelium. Proc Natl Acad Sci U S A. 2002;99:11890–11895. - PMC - PubMed
    1. Pritchard CC, Nelson PS. Gene expression profiling in the developing prostate. Differentiation. 2008;76:624–640. - PubMed
    1. Tindall DJ, Rittmaster RS. The rationale for inhibiting 5alpha-reductase isoenzymes in the prevention and treatment of prostate cancer. J Urol. 2008;179:1235–1242. - PMC - PubMed
    1. Uemura M, Tamura K, Chung S, et al. Novel 5 alpha-steroid reductase (SRD5A3, type-3) is overexpressed in hormone-refractory prostate cancer. Cancer Sci. 2008;99:81–86. - PMC - PubMed
    1. Thompson IM, Goodman PJ, Tangen CM, et al. The influence of finasteride on the development of prostate cancer. N Engl J Med. 2003;349:215–224. - PubMed

Publication types

MeSH terms