. 2010 Apr 1;115(13):2709-18.
doi: 10.1182/blood-2009-05-223776. Epub 2010 Feb 2.

c-Abl mediates endothelial apoptosis induced by inhibition of integrins alphavbeta3 and alphavbeta5 and by disruption of actin

Affiliations

c-Abl mediates endothelial apoptosis induced by inhibition of integrins alphavbeta3 and alphavbeta5 and by disruption of actin

Jingying Xu et al. Blood. .

Abstract

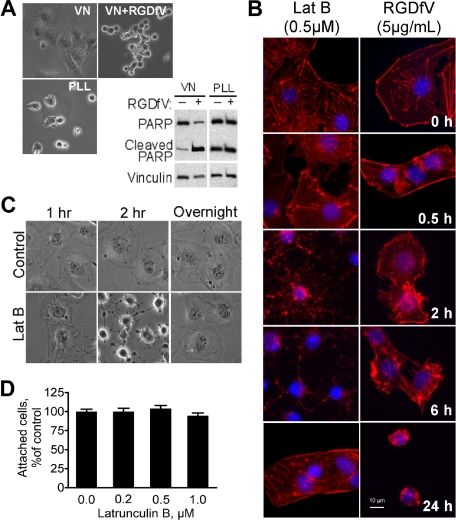
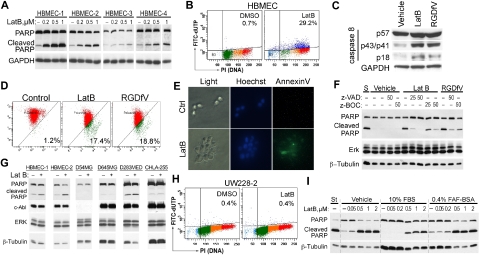
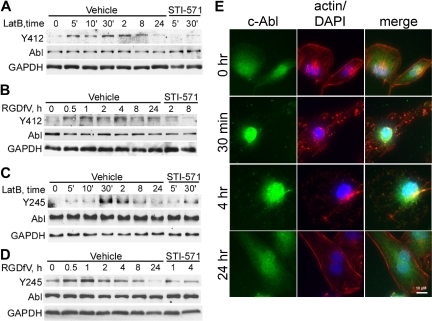
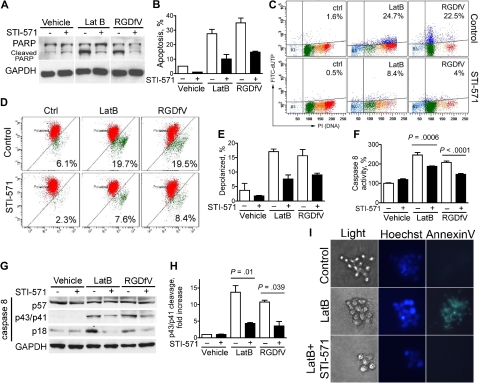
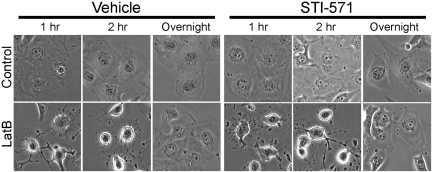
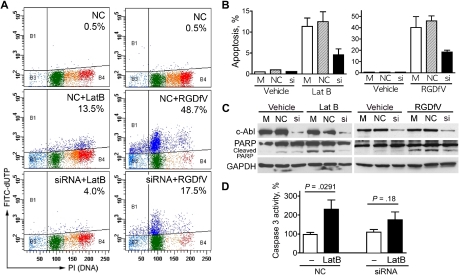
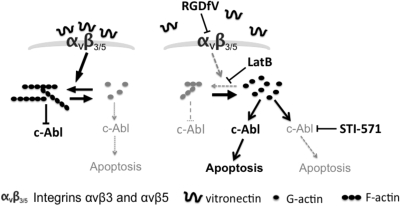
Inhibition of integrins alphavbeta3 and alphavbeta5 in human brain microvascular endothelial cells (HBMECs) by the function-blocking peptide RGDfV induces loss of spreading on vitronectin, cell detachment, and apoptosis. We demonstrate that cell detachment is not required for apoptosis because plating on bovine serum albumin-blocked poly-L-lysine (allows attachment, but not integrin ligation and cell spreading) also induced apoptosis. Latrunculin B (LatB), which inhibits F-actin polymerization, induced transient loss of HBMEC spreading on vitronectin, but not their detachment, and induced apoptosis despite recovery of cell spreading. However, LatB did not cause apoptosis in 5 tumor cell lines. In HBMECs, both LatB and RGDfV induced transient Y412 and Y245 phosphorylation of endogenous c-Abl, a nonreceptor tyrosine kinase that reciprocally regulates F-actin. LatB also induced nuclear translocation of c-Abl in HBMECs. STI-571 (imatinib), a targeted therapy for BCR-ABL1(+) leukemias and inhibitor of c-Abl, platelet-derived growth factor receptor, and c-Kit, decreased endothelial apoptosis. LatB-induced HBMEC apoptosis, and its inhibition by STI-571 also occurred in a 3-dimensional collagen model, supporting physiologic relevance. Last, siRNA to c-Abl (but not nonspecific siRNA) also inhibited RGDfV- and LatB-induced apoptosis. Thus, endogenous c-Abl mediates endothelial apoptosis induced by inhibition of integrins alphavbeta3/alphavbeta5 or by LatB-induced disruption of F-actin.


Figures

Figure 1
Figure 1
LatB transiently disrupts spreading of HBMECs but does not induce cell detachment. Endothelial apoptosis induced by RGDfV does not require cell detachment. (A) HBMECs were seeded on VN or PLL, both blocked with HD-BSA, and incubated for 24 hours. Where indicated, RGDfV (5 μg/mL) was added after cells were spread for 4 hours. Cells were photographed (original magnification ×400) or harvested, and lysates were subjected to sodium dodecyl sulfate–polyacrylamide gel electrophoresis (SDS-PAGE) and Western blotting for PARP cleavage. Vinculin served as loading control. (B) HBMECs (3000 cells/well) were allowed to adhere and spread for 2 hours on VN-coated/HD-BSA–blocked 8-well chamber slides. RGDfV (5 μg/mL) or LatB (0.5μM) was added in 0.4% BSA/RPMI 1640 for 0.5, 2, 6, or 24 hours. Cells were permeabilized and stained with phalloidin, counterstained with DAPI, and photographed (original magnification ×400). (C) HBMECs were seeded on VN-coated/HD-BSA–blocked 6-well plates in 0.4% BSA/RPMI 1640. LatB (0.2μM) or vehicle was then added for 1, 2, or 20 hours (overnight), and plates were photographed. Shown are representative cells (all cells underwent the transient shape change after LatB treatment; original magnification ×400). (D) HBMECs (104 cells/well) were seeded on VN-coated/HD-BSA–blocked 48-well plates and allowed to adhere and spread for 2 hours before LatB (0.2μM) in 0.4% BSA/RPMI 1640 was added. After overnight incubation, nonadherent cells were washed off and the adherent cells were enumerated using methyl-thiazol-tetrazolium assay. Data are mean ± SD; n = 16 for each mean. P > .05.
Figure 2
Figure 2
LatB induces caspase-dependent endothelial apoptosis. (A,G) Isolates of HBMECs from 4 (A) or 2 (G) different donors, or tumor cells (4 × 10⁵/well) were allowed to spread on VN-coated/HD-BSA–blocked 6-well plates and then incubated for 24 hours with 0 to 1μM (A) or 0.2μM (G) LatB in 0.4% BSA/RPMI 1640. Whole-cell lysates were resolved on 10% SDS-PAGE and analyzed by Western blotting (PARP cleavage and c-Abl). (A) The blot of PARP cleavage for HBMECs-3 and HBMECs-4 is shown at longer exposure than for HBMECs-1 and HBMECs-2 resulting from lower PARP expression in HBMECs-3 and HBMECs-4. GAPDH or ERK 1/2 and β-tubulin served as loading controls. (B) HBMECs (2 × 10⁵ cells/well) seeded on VN-coated/HD-BSA–blocked 6-well plates in 0.4% BSA/RPMI 1640 were treated with vehicle or LatB (0.5μM) for 48 hours. Apoptosis was assessed by flow cytometry using the Apo-Direct kit, measuring FITC-dUTP and PI content. Percentage of apoptotic cells (FITC-dUTP+ cells in top quadrants) is indicated for each condition. Shown is a representative panel from 1 experiment of 12 with similar results. (C) HBMECs (2 × 10⁵ cells/well) were allowed to spread on VN-coated/HD-BSA–blocked 6-well plates and then incubated for 24 hours with 0.5μM LatB or 5 μg/mL RGDfV in 0.4% BSA/RPMI 1640. Whole-cell lysates were resolved on 12.5% SDS-PAGE and analyzed by Western blotting for caspase-8 cleavage. GAPDH served as loading control. (D) HBMECs treated as in panel C were analyzed by flow cytometry for effect on mitochondrial polarization. Loss of mitochondrial membrane potential (ΔΨm) was measured by flow cytometry using the JC-1 mitochondrial probe. The transition of red fluorescence to green indicates mitochondrial membrane depolarization by the drug(s). Indicated are the percentages of mitochondrial membrane-depolarized cells. (E) HBMECs (5 × 10⁴ cells/mL) were cultured in 3D collagen as described in supplemental Data and treated with LatB (0.5μM) for 18 hours. Cells were stained with Hoechst and annexin V–FITC and photographed by light microscopy or fluorescence. Shown are representative fields from each condition (original magnification ×400). (F) HBMECs spread on VN in serum-free RPMI 1640 were preincubated with the caspase inhibitors zVAD-FMK or zBOC-FMK (25μM or 50μM) or vehicle control for 2 hours, and then LatB (0.05μM) or RGDfV (5 μg/mL) was added for another 24 hours. Whole-cell lysates were resolved on 10% SDS-PAGE and analyzed by Western blotting (PARP cleavage, ERK, β-tubulin). (H) UW228-2 medulloblastoma cells (2 × 10⁵ cells/well) seeded on 6-well plates were treated for 48 hours with LatB (0.5μM) as in panel A, and apoptosis was analyzed by flow cytometry as in panel B. (I) HBMECs (4 × 10⁵/well) were cultured in 6-well plates in RPMI 1640 without additions, or in the presence of 10% FBS or 0.4% FAF-BSA. After cells were spread, 0 to 2μM LatB was added for 24 hours as indicated, and lysates were processed as indicated in panel A.
Figure 3
Figure 3
c-Abl is phosphorylated and undergoes subcellular localization change in the presence of LatB and RGDfV. (A-D) HBMECs (2 × 10⁵ cells/well) were seeded on VN-coated/HD-BSA–blocked 6-well plates in 0.4% BSA/RPMI 1640 and treated with LatB (0.5μM; A,C) or RGDfV (5 μg/mL; B,D) for the times indicated. (A,C) The short time points (5-30 minutes) are labeled as 5′, 10′, and 30′, and the remainder of the lanes were incubated for 2 to 24 hours. Where indicated, STI-571 (5μM) was also included in the medium, starting 30 minutes before LatB or RGDfV. Whole-cell lysates were resolved on 10% SDS-PAGE and analyzed by Western blotting for c-Abl (SH2 domain, 8E9 antibody) and tyrosine phosphorylation, with either phospho-c-Abl-Y412 (A-B) or phospho-c-Abl-Y245 (C-D). GAPDH served as loading control. (E) To examine c-Abl translocation, HBMECs (3000 cells/well) were allowed to adhere and spread overnight on VN-coated/HD-BSA–blocked 8-well chamber slides. LatB (0.2μM) was added in 0.4% BSA/RPMI 1640 for 0.5, 4, or 24 hours. Cells were permeabilized and stained with phalloidin (actin, red), c-Abl (8E9, green), counterstained with DAPI (nucleus, blue), and photographed. Shown is representative field (original magnification ×400).
Figure 4
Figure 4
STI-571 decreases apoptosis induced by LatB and RGDfV in HBMECs. HBMECs (2 × 10⁵ cells/well) were seeded and allowed to spread on VN-coated/HD-BSA–blocked 6-well plates in 0.4% BSA/RPMI 1640. Cells were then treated for 16 hours (I), 24 hours (A, D-H), or 48 hours (B-C) with vehicle, LatB (0.5μM) or RGDfV (5 μg/mL). Where indicated, STI-571 (5μM) was included 30 minutes before LatB or RGDfV. (A) Whole-cell lysates were resolved on 10% SDS-PAGE and analyzed by Western blotting for PARP cleavage. GAPDH served as loading control. (B-C) Apoptosis was assessed by flow cytometry using the Apo-Direct kit, measuring FITC-dUTP and PI content. Percentage of apoptotic cells in the 2 top quadrants is indicated. (B) Mean ± SEM of 3 independent experiments performed in triplicate as in panel C. P < .001 between presence or absence of STI-571 for each pair. (C) One representative experiment (percentage of apoptotic cells in the 2 top quadrants) is indicated. (D-E) Loss of mitochondrial membrane potential (ΔΨm) was measured by flow cytometry using JC-1 mitochondrial probe. (D) Representative flow cytometry plots. The values indicated represent the percentage of cells with depolarized mitochondrial membrane. The bars in panel E represent mean ± SEM percentage of cells with depolarized mitochondrial membrane potential from 2 experiments performed in triplicate. P < .001 between LatB with or without STI-571. P = .044 for RGDfV with or without STI-571. (F) Whole-cell lysates were analyzed for caspase-8 activity using the ApoTarget caspase-8/FLICE colorimetric protease assay. Bars represent mean ± SEM. P < .001 between LatB treatment with or without STI-571, P < .001 between RGDfV treatment with or without STI-571 (n = 4 replicates, shown is 1 of 2 experiments with similar results). (G-H) Whole- cell lysates were resolved on 12.5% SDS-PAGE and analyzed by Western blotting for caspase-8 cleavage. GAPDH served as loading control. (H) Mean densitometry of the cleaved caspase-8 p43/p41 fragment relative to GAPDH in 3 separate experiments. (I) HBMECs were cultured in 3D collagen as described in “Methods.” Cells were stained with Hoechst and annexin V–FITC, and photographed (original magnification ×400).
Figure 5
Figure 5
STI-571 does not alter the change in cell shape induced by LatB. HBMECs were seeded on VN blocked with HD-BSA and preincubated (2 hours) with STI-571 (5μM). LatB (0.5μM) or vehicle was added for the duration indicated, and cells were photographed (original magnification ×400).
Figure 6
Figure 6
c-Abl is required in apoptosis induced by LatB and RGDfV. HBMECs (2 × 10⁵ cells/well) seeded overnight on VN-coated/HD-BSA–blocked 6-well plates in 0.4% BSA/RPMI 1640 were transfected with nonspecific nonsilencing negative control siRNA, or c-Abl siRNA (100pM) for 5 hours or were mock-transfected (Lipofectamine 2000 without siRNA). LatB (0.5μM) or RGDfV (5 μg/mL) was added 30 hours after transfection. M indicates mock control; NC, nonspecific nonsilencing negative siRNA control; si, c-Abl siRNA. (A-B) Cells were collected 40 hours after LatB (0.5μM) or RGDfV (5 μg/mL) treatment (70 hours after transfection), and apoptosis was assessed by flow cytometry using the Apo-Direct kit, measuring FITC-dUTP and PI content. Percentage of apoptotic cells in the top quadrants is indicated. (A) Representative experiment of 3 with similar results. (B) Mean ± SEM of the 3 experiments. P < .001 between c-Abl siRNA and each of the controls (mock and nonspecific siRNA) in the presence of LatB- or RGDfV-treated groups. (C) Whole-cell lysates were collected after 24 hours of LatB (0.5μM) or RGDfV (5 μg/mL) treatment (54 hours after transfection) and analyzed by Western blotting for PARP cleavage and c-Abl (K-12 antibody). GAPDH served as loading control. (D) Whole-cell lysates were collected 24 hours after LatB (0.5μM) treatment (54 hours after transfection) and analyzed for caspase-3 activity using the ApoTarget caspase-3/CPP32 colorimetric protease assay. Bars represent mean ± SEM. P = .029 between nonspecific nonsilencing negative siRNA control with or without LatB. P = .18 between c-Abl-siRNA with or without LatB (n = 5 for each condition).
Figure 7
Figure 7
Model summary of integrins, actin, c-Abl, and apoptosis. Our data support a model in which under baseline conditions, integrin signaling supports polymerization of F-actin and F-actin maintains c-Abl in its inactive state, thus permitting survival (left). Inhibition of integrin αvβ3/αvβ5 by RGDfV or treatment with LatB both results in decreased F-actin, which then relieves the inhibition from c-Abl, allowing c-Abl to mediate apoptosis (right). Inhibition of the activated c-Abl using STI-571 (right) can inhibit the apoptosis despite the continued disruption of F-actin.

Similar articles

Cited by

References

    1. Cheresh DA, Stupack DG. Regulation of angiogenesis: apoptotic cues from the ECM. Oncogene. 2008;27(48):6285–6298. - PubMed
    1. Delon I, Brown NH. Integrins and the actin cytoskeleton. Curr Opin Cell Biol. 2007;19(1):43–50. - PubMed
    1. Somanath PR, Ciocea A, Byzova TV. Integrin and growth factor receptor alliance in angiogenesis. Cell Biochem Biophys. 2009;53(2):53–64. - PMC - PubMed
    1. Friedlander M, Theesfeld CL, Sugita M, et al. Involvement of integrins αvβ3 and αvβ5 in ocular neovascular diseases. Proc Natl Acad Sci U S A. 1996;93(18):9764–9769. - PMC - PubMed
    1. Mahabeleshwar GH, Chen J, Feng W, Somanath PR, Razorenova OV, Byzova TV. Integrin affinity modulation in angiogenesis. Cell Cycle. 2008;7(3):335–347. - PMC - PubMed

Publication types

MeSH terms