. 2010 Jan 26;8(1):e1000296.
doi: 10.1371/journal.pbio.1000296.

Global regulator SATB1 recruits beta-catenin and regulates T(H)2 differentiation in Wnt-dependent manner

Affiliations

Global regulator SATB1 recruits beta-catenin and regulates T(H)2 differentiation in Wnt-dependent manner

Dimple Notani et al. PLoS Biol. .

Expression of concern in

Abstract

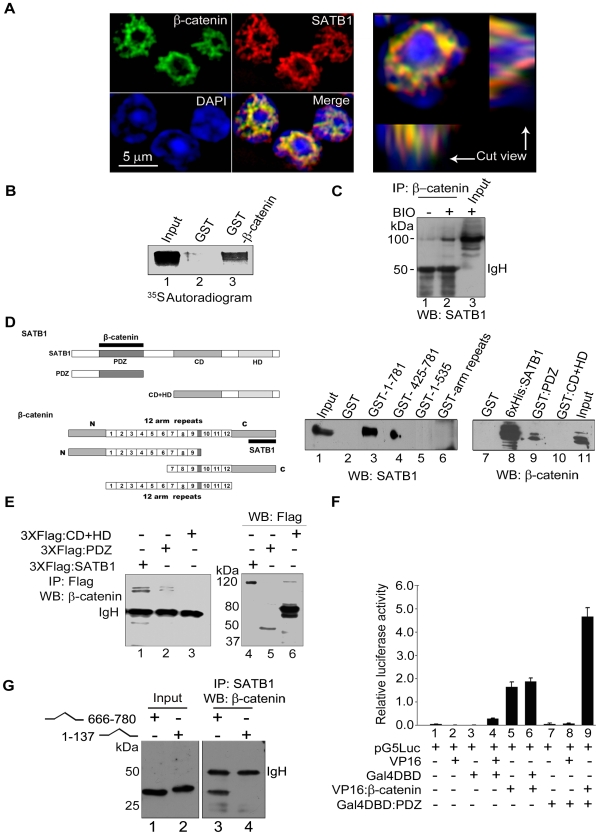
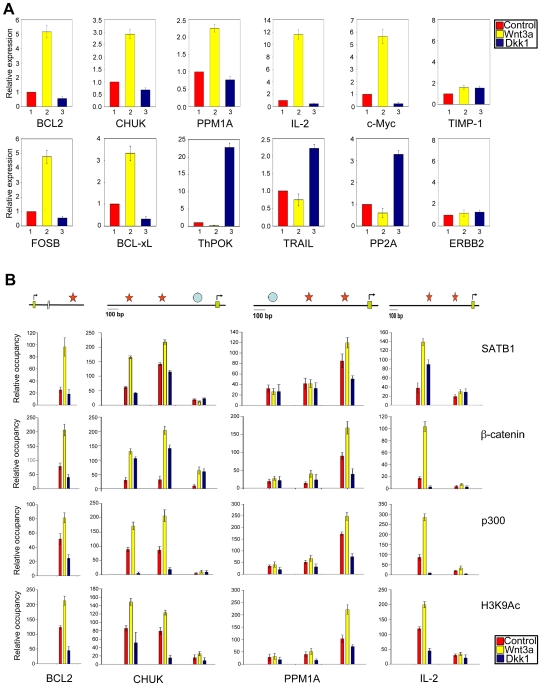
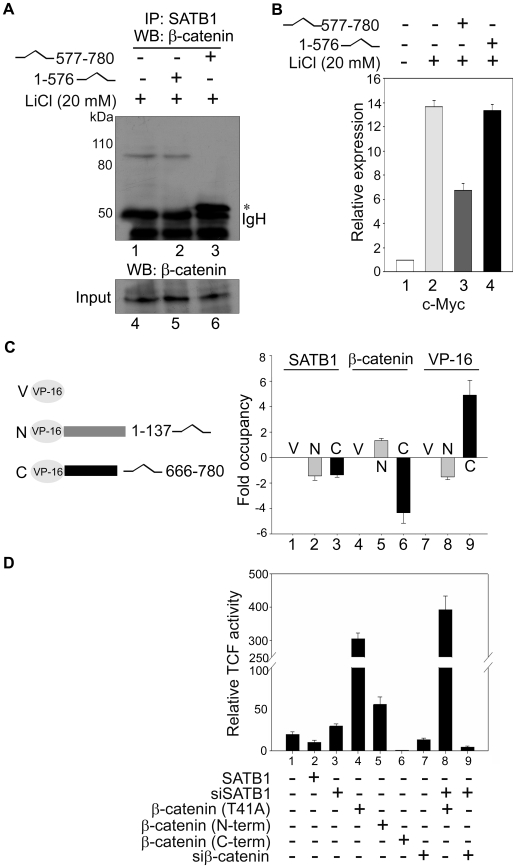
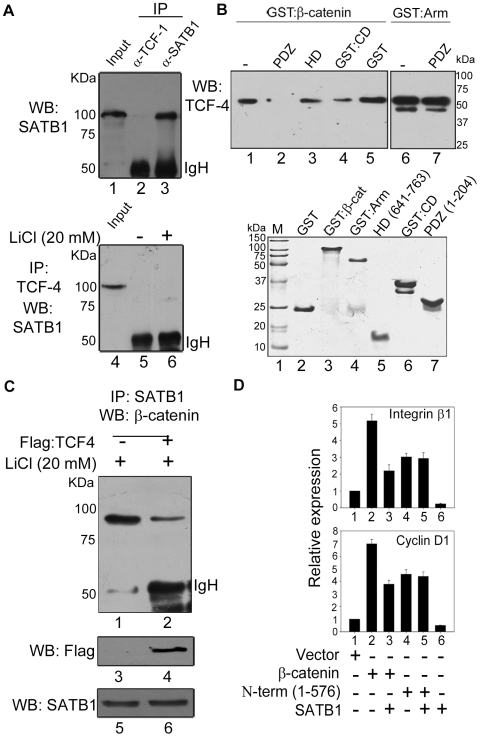
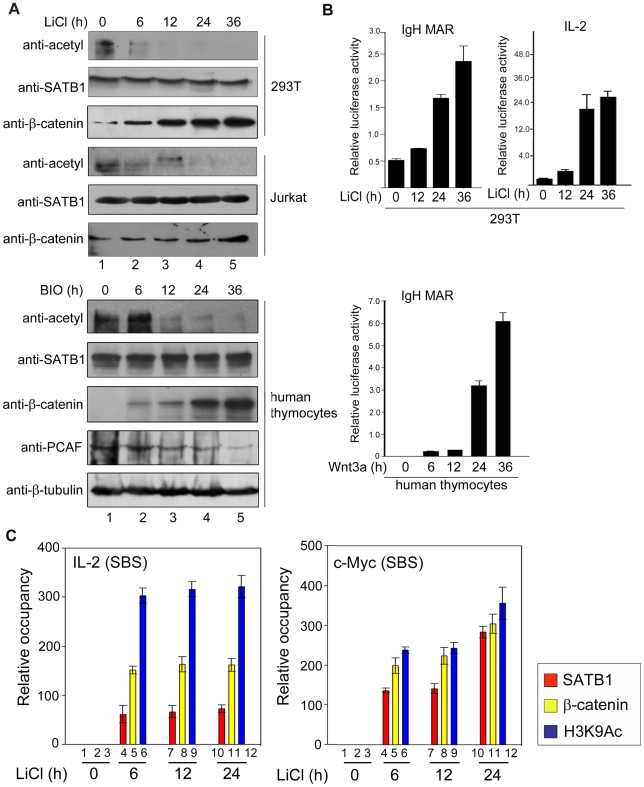
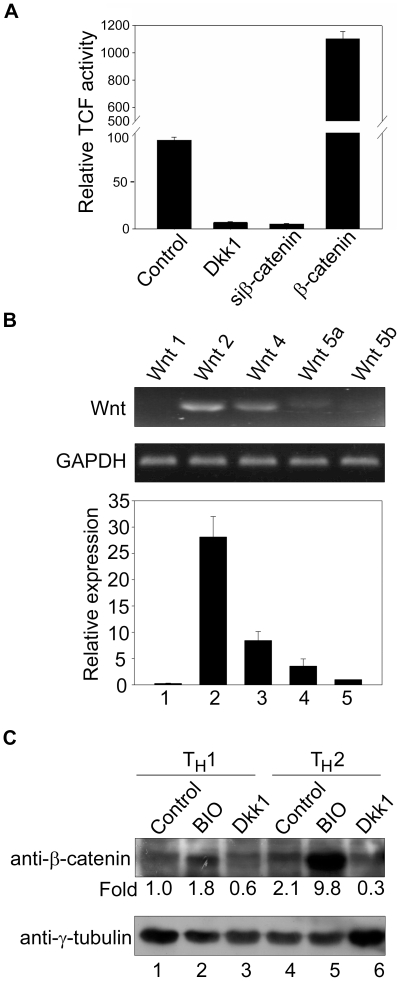
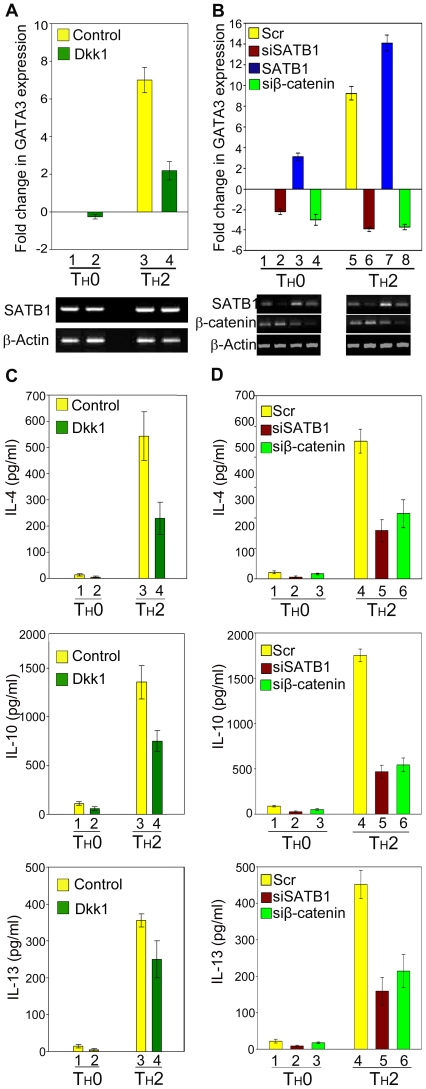
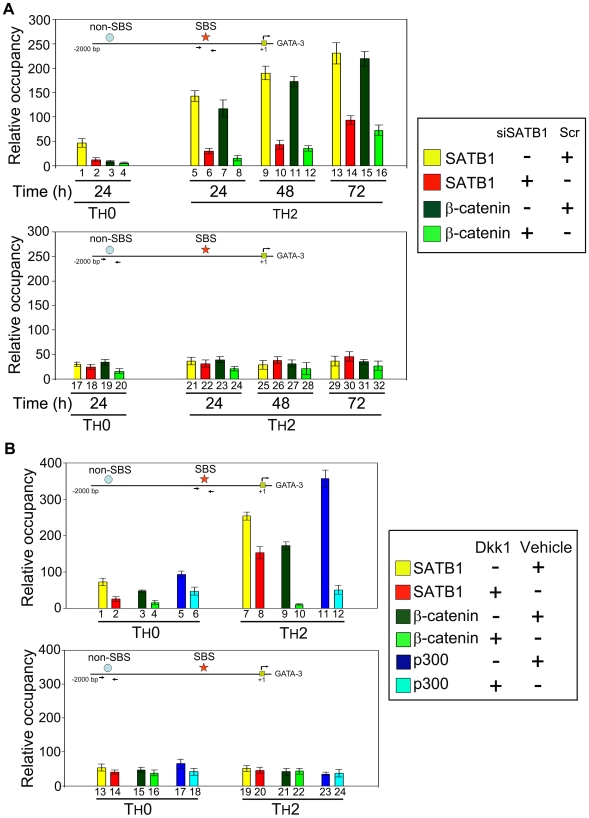
In vertebrates, the conserved Wnt signalling cascade promotes the stabilization and nuclear accumulation of beta-catenin, which then associates with the lymphoid enhancer factor/T cell factor proteins (LEF/TCFs) to activate target genes. Wnt/beta -catenin signalling is essential for T cell development and differentiation. Here we show that special AT-rich binding protein 1 (SATB1), the T lineage-enriched chromatin organizer and global regulator, interacts with beta-catenin and recruits it to SATB1's genomic binding sites. Gene expression profiling revealed that the genes repressed by SATB1 are upregulated upon Wnt signalling. Competition between SATB1 and TCF affects the transcription of TCF-regulated genes upon beta-catenin signalling. GATA-3 is a T helper type 2 (T(H)2) specific transcription factor that regulates production of T(H)2 cytokines and functions as T(H)2 lineage determinant. SATB1 positively regulated GATA-3 and siRNA-mediated knockdown of SATB1 downregulated GATA-3 expression in differentiating human CD4(+) T cells, suggesting that SATB1 influences T(H)2 lineage commitment by reprogramming gene expression. In the presence of Dickkopf 1 (Dkk1), an inhibitor of Wnt signalling, GATA-3 is downregulated and the expression of signature T(H)2 cytokines such as IL-4, IL-10, and IL-13 is reduced, indicating that Wnt signalling is essential for T(H)2 differentiation. Knockdown of beta-catenin also produced similar results, confirming the role of Wnt/beta-catenin signalling in T(H)2 differentiation. Furthermore, chromatin immunoprecipitation analysis revealed that SATB1 recruits beta-catenin and p300 acetyltransferase on GATA-3 promoter in differentiating T(H)2 cells in a Wnt-dependent manner. SATB1 coordinates T(H)2 lineage commitment by reprogramming gene expression. The SATB1:beta-catenin complex activates a number of SATB1 regulated genes, and hence this study has potential to find novel Wnt responsive genes. These results demonstrate that SATB1 orchestrates T(H)2 lineage commitment by mediating Wnt/beta-catenin signalling. This report identifies a new global transcription factor involved in beta-catenin signalling that may play a major role in dictating the functional outcomes of this signalling pathway during development, differentiation, and tumorigenesis.


Conflict of interest statement

The authors have declared that no competing interests exist.

Figures

Figure 1
Figure 1. Delineation of physical interaction between SATB1 and β-catenin.
(A) SATB1 and β-catenin colocalize in the thymocyte nuclei. Indirect immunofluorescence staining of thymocytes using antibodies to SATB1 (red) and β-catenin (green) was performed as described in Materials and Methods. DNA counterstaining was performed using DAPI (blue). The cut view panel depicts two perpendicular transverse sections of a triple-stained thymocyte as indicated by white lines, intersecting at the point of the brightest fluorescence signal. (B) Direct interaction between SATB1 and β-catenin was monitored by in vitro pulldown assays performed as described in Materials and Methods. 35S-labeled SATB1 was specifically pulled down after incubation with immobilized GST-β-catenin (lane 3) and not with control immobilized GST (lane 2). (C) In vivo interaction of SATB1 and β-catenin was assessed by performing coimmunoprecipitation analysis as described in Materials and Methods. Nuclear extracts derived from BIO treated (+) and control (−) human thymocytes were immunoprecipitated using anti-β-catenin followed by WB with anti-SATB1. (D) The interacting regions of SATB1 and β-catenin were mapped by in vitro pulldown assay. GST pulldowns of SATB1 and β-catenin were performed by passing Jurkat nuclear extract on immobilized domains of GST-β-catenin (lanes 1–6) and SW480 nuclear extract on immobilized domains of SATB1 (lanes 7–11) including both full-length proteins followed by WB with anti-SATB1 and anti-β-catenin. SATB1 and β-catenin truncations used are depicted schematically on the left. Solid black bars depict the respective interacting regions. (E) Coimmunoprecipitation analysis of extracts derived from HEK 293T cells overexpressing 3XFlag-SATB1 and its functional domains using anti-Flag antibody followed by WB with anti-β-catenin (lanes 1–3). Expression levels of the 3XFlag-fused domains of SATB1 were monitored by WB using anti-Flag (lanes 4–6). (F) Mammalian two hybrid assay was performed to score for protein-protein interactions in HEK 293T cells essentially as described . The C-terminus of β-catenin and the PDZ-like domain of SATB1 were expressed as fusions with VP-16 and GAL4-DBD using the pACT and pBIND vectors of the CheckMate mammalian two-hybrid system (Promega). pBIND and pACT fusion constructs were transfected along with a reporter vector pG5-Luc containing 4× GAL4 responsive element and luciferase activity was compared with the control. Error bars represent standard deviation calculated from triplicates. (G) The C-terminus and not the N-terminus of β-catenin is involved in its interaction with SATB1. VP-16 fused C-terminal (aa 666–780, lane 1) and N-terminal (aa 1–137, lane 2) regions of β-catenin were overexpressed in HEK 293T cells. Co-immunoprecipitation was performed as described in Materials and Methods using anti-SATB1 followed by WB using anti-β-catenin.
Figure 2
Figure 2. Wnt signalling results in upregulation of SATB1 targeted genes by recruitment of β-catenin-p300 complex.
(A) Effect of Wnt signalling on the transcription status of representative SATB1 regulated genes (Upper row) and Wnt regulated genes (lower row) in thymocytes. Quantitative RT-PCR analysis was performed using RNA extracted from control human thymocytes (bar 1) and thymocytes treated for 48 h with Wnt3a (bar 2), or Dkk1 (bar 3) as described in Materials and Methods. The values for gene expression in treated cells were normalized with respect to the untreated control, which was set to 1. Each error bar indicates standard deviation calculated from triplicates. TIMP-1 and ERBB2 served as control genes such that TIMP-1 is not regulated by both SATB1 and β-catenin, whereas ERBB2 served as SATB1-dependent but β-catenin-independent control gene. (B) Occupancy of SATB1, β-catenin, p300 acetyltransferase, and H3K9 acetylation across the 1 kb upstream regulatory regions of SATB1 regulated genes Bcl-2, PPM1A, CHUK, and IL-2 was monitored by ChIP analysis. Chromatin was isolated from control, Wnt3a, or Dkk1 treated human thymocytes and ChIP analysis was performed as described in Materials and Methods. Relative occupancy was calculated by performing quantitative real-time PCR analysis and normalizing the C T values with input and IgG controls. Each error bar indicates standard deviation calculated from triplicates. The relative positions of regions analyzed by ChIP within respective genes are schematically indicated above their occupancy profiles. Stars represent in vitro SBSs whereas circles denote non-binding sites. Names of genes are depicted below each column of graphs, whereas that of antibodies used for ChIP are depicted on the right side of each row.
Figure 3
Figure 3. Direct interaction between SATB1 and β-catenin is essential for target gene regulation.
(A) Overexpression of truncated β-catenin (577–780 aa) competitively overcomes association of SATB1 with endogenous full-length β-catenin. Co-immunoprecipitation was performed using extracts from LiCl-treated HEK 293T cells with anti-SATB1 followed by WB using anti-β-catenin as described in Materials and Methods. Asterisk indicates position of the immunoprecipitated truncated C-terminus of β-catenin, which migrates just above the immunoglobulin heavy chain (IgH). Lower panel depicts WB with input extracts used for co-immunoprecipitation. (B) Effect of SATB1–β-catenin interaction on the transcription status of the SATB1 regulated gene c-Myc. Quantitative RT-PCR analysis was performed as described in Materials and Methods using RNA extracted from HEK 293T cells without LiCl treatment (bar 1, normalized to unit value), with LiCl (bars 2–4), and transfected with C-term (577–780 aa) (bar 3) and N-term (1–576 aa) (bar 4) of β-catenin. Cells were cultured for 48 h after administering all these treatments prior to isolation of RNA. Each error bar depicts standard deviation calculated from triplicates. (C) Overexpression of truncated β-catenin C-terminus (666–780 aa) competitively overcomes association of endogenous full-length β-catenin on SATB1 genomic targets. HEK 293T cells were transfected with pACT vector encoding either the VP16 tag, VP16-fused N-term (1–137 aa), or C-term (666–780 aa) domains of β-catenin and treated with LiCl. After 24 h, cells were harvested and chromatin was isolated by sonication and subjected to ChIP assay using antibodies indicated above the bars. The antibody to β-catenin used in this assay was raised against its N-terminus. The expression vectors and constructs used are depicted schematically on the left. ChIP-PCRs were performed using oligonucleotide primers specific to c-Myc-SBS as described in Materials and Methods. Graph depicts fold enrichment of the ChIP-PCR products over the vector control (“V”) measured by quantitative real-time PCR analysis. Negative values indicate reduced occupancy, whereas positive values depict increased occupancy with respect to the vector control. Grey and black bars represent the fold changes in occupancy of SATB1 (bars 2–3), β-catenin (bars 5–6), and VP16 (bars 8–9) in LiCl treated HEK 293T cells overexpressing the N-term (“N”) or the C-term (“C”) domain truncations of β-catenin, respectively. (D) Wnt signalling activity was measured by performing transactivation assay in HEK 293T cells using the TOPFlash and FOPFlash reporter constructs and cotransfections of SATB1, β-catenin (T41A), siSATB1, si-β-catenin, β-catenin N-term (1–576 aa), and β-catenin C-term (577–780 aa) in indicated combinations. The T41A mutant of β-catenin used in reporter assays cannot be phosphorylated by GSK-3β and is therefore constitutively stabilized and activated. The reporter activity was measured after 48 h as described in Materials and Methods. The ratio of luciferase activities in TOPFlash-transfected versus FOPFlash-transfected cells was determined and plotted as the relative TCF activity. Each error bar indicates standard deviation calculated from triplicates.
Figure 4
Figure 4. Competition between TCF and SATB1 for recruitment of β-catenin affects the TCF mediated transcription regulation.
(A) SATB1 does not interact with TCF proteins. Immunoprecipitation was performed as described in Materials and Methods. Nuclear extracts derived from human thymocytes treated with LiCl treated for 24 h were immunoprecipitated using anti-TCF-1 (lane 2) and anti-SATB1 (lane 3) followed by immunoblot with anti-SATB1. Similarly, immunoprecipitation was performed by incubating anti-TCF-4 with nuclear extracts from HEK 293T cells cultured in the presence (lane 6) and absence (lane 5) of LiCl for 24 h followed by immunoblot with anti-SATB1. Input (lanes 1 and 5) represents 5% of the nuclear extract used for IP. (B) In vitro competition assay was performed as described in Materials and Methods. TCF-4 contains all known functional domains of the TCF family proteins. Briefly, TCF-4 from nuclear extracts of Flag-TCF-4 transfected HEK 293 T cells was separately bound to GST-β-catenin (lanes 1–5) or GST-Arm (lanes 6–7) immobilized on glutathione-Sepharose. The bound complex was then incubated with various recombinant proteins as indicated, and the TCF-4 remaining bound to the column was monitored by Western blot analysis. “-” indicates that no protein was added and TCF-4 was eluted directly from the column. The upper panels represent WB analysis using anti-TCF-4, whereas the lower panel depicts Coomassie brilliant blue-stained SDS-polyacrylamide gel (15%) profile of various recombinant proteins used. (C) SATB1 and TCF-4 compete in vivo for association with β-catenin. Co-immunoprecipitation was performed to pulldown the SATB1:β-catenin complex from LiCl treated extracts from HEK 293T cells transfected with Flag-TCF4 (lane 2) or with empty vector (lane 1). IP and WB were performed using anti-SATB1 and anti-β-catenin, respectively. Expression of Flag-TCF4 and SATB1 was monitored by immunoblot analysis using respective antibodies as indicated in middle and lower panels. (D) SATB1 represses TCF targets in vivo. HEK 293T cells were transfected with indicated constructs for overexpression of full-length β-catenin (T41A), N-term β-catenin (1–567 aa), and SATB1 or empty vector in indicated combinations. β-catenin proteins encoded by both these constructs can translocate into nucleus and are therefore capable of transactivating Wnt/TCF/β-catenin targets; however, the N-term (1–576) protein does not interact with SATB1. RNA was isolated 48 h after transfection, and quantitative transcript profiling of TCF responsive genes integrin β1 and cyclin D1 was performed by real-time RT-PCR analysis as described in Materials and Methods.
Figure 5
Figure 5. β-catenin signalling enhances SATB1 binding on its targets in vivo.
(A) Deacetylation of SATB1 is a functional consequence of Wnt/β-catenin signalling. SATB1 was immunoprecipitated using nuclear extracts from LiCl treated HEK 293T and Jurkat cells and BIO treated human thymocytes at indicated time points, followed by WB with anti-pan-acetyl antibody. Lower panels indicate expression levels of SATB1 and β-catenin during the time course. While levels of SATB1 did not change much during this time course, β-catenin was progressively stabilized indicating that Wnt/β-catenin signalling is active in all three cell types. Immunoblot analysis of these extracts with anti-PCAF revealed downregulation of PCAF upon induction of Wnt signalling in human thymocytes. Immunoblot with anti-β-tubulin served as a loading control for thymocyte extracts. (B) MAR-linked reporter activity is upregulated upon induction of Wnt signalling. The activity of IgH-MAR and IL-2 reporter during the time course of LiCl treatment in HEK-293T cells or that of IgH-MAR reporter in Wnt3a treated human thymocytes was monitored as described in Materials and Methods. Each error bar represents standard deviation calculated from triplicates, and the p values are less than 0.001. (C) ChIP analysis was performed to monitor the occupancy of SATB1, β-catenin, and H3K9Ac at the SBSs within the IL-2 and c-Myc loci as described in Materials and Methods. Change in occupancy was calculated from real-time PCR analysis of respective SBSs using anti-SATB1, anti-β-catenin, and anti-H3K9Ac immunoprecipitated chromatin from Jurkat cells treated with LiCl over 24 h. Occupancy at zero time was considered as base line control and the change in occupancy at other time points was calculated as relative occupancy with respect to the control.
Figure 6
Figure 6. Wnt signalling is active in naïve CD4+ T cells and differentiating TH cells.
(A) Naïve CD4+ T cells were isolated from cord blood as described in Materials and Methods. Wnt signalling activity was measured by performing transactivation assay using TOPFlash and FOPFlash reporter constructs. TCF reporter activity was measured after 48 h in untreated control cells (bar 1), cells treated with Wnt inhibitor Dkk1 (bar 2), and upon cotransfections of si-β-catenin (bar 3) and β-catenin (T41A) (bar 4) as indicated. In all samples the reporter activity was measured without adding any Wnt agonist. The ratio of luciferase activities in TOPFlash transfected versus FOPFlash-transfected cells was determined and plotted as the relative TCF activity. Each error bar indicates standard deviation calculated from triplicates. (B) Expression of Wnts in CD4+ T cells. Naïve CD4+ T cells were isolated from cord blood as described in Materials and Methods. The mRNA levels of indicated Wnts were determined by RT-PCR analysis of total RNA extracted from these cells (top panel). Wnt expression was also monitored by quantitative RT-PCR analysis of RNAs from two biological replicates (lower graph). Expression level of Wnt 5b was considered as one unit for calculating relative fold expression of other Wnts after normalizing with GAPDH expression in the same sample. (C) Immunoblot analysis was performed to monitor stabilization of β-catenin in differentiating TH cells. Naïve CD4+ cells were activated using plate-bound anti-CD3 and soluble anti-CD28 and differentiated by adding IL-4 or IL-12 as described in Materials and Methods. Nuclear extracts were prepared from control cells and cells polarized to TH1 and TH2 and were treated with Wnt agonist BIO or Wnt inhibitor Dkk1, followed by immunoblot analysis using anti-β-catenin (upper panel) and anti-γ-tubulin (lower panel). Each lane represents protein isolated from 5×10⁶ differentiated and treated cells. The numbers below the β-catenin panel represent fold change in β-catenin expression in the indicated lanes of the immunoblot upon normalization with that of γ-tubulin as loading control. Fold change values were calculated from densitometric quantitation of respective bands. Numbers below the γ-tubulin panel denote individual lanes of the immunoblot.
Figure 7
Figure 7. SATB1 and β-catenin regulate expression of GATA3 and TH2 cytokines in a Wnt-dependent manner in differentiating TH2 cells.
(A) Active Wnt signalling is important for T helper cell differentiation. TH cells were differentiated ex vivo in the presence or absence of Dkk1 as described in Materials and Methods . Control cells were treated with the vehicle (1×PBS) only. Upon polarization for 72 h, total RNA was isolated and GATA-3 transcripts were analyzed by quantitative RT-PCR as described in Materials and Methods. GATA-3 expression was normalized with β-actin expression in these cells. The graph shows transcript levels of GATA-3 in control and Dkk1 treated TH cells. Fold changes were calculated with respect to the control TH0 subset in which the GATA-3 expression level was set to baseline (bar 1). Each error bar represents standard deviation calculated from triplicates. Lower panels depict the corresponding transcript profile of SATB1 and β-actin. (B) SATB1 and β-catenin regulate GATA-3 expression in T helper cells. Naïve CD4+ T cells were transfected with duplex siSATB1, siβ-catenin, or SATB1 overexpression plasmid DNA as described in Materials and Methods and differentiated ex vivo as described . As control, duplex scrambled RNA (Scr) was transfected. Upon polarization for 72 h, total RNA was isolated and GATA-3 transcripts were analyzed by quantitative RT-PCR as described in Materials and Methods. GATA-3 expression was normalized with β-actin expression in these cells. The graph shows fold changes in GATA-3 transcript in control (Scr) (bars 1 and 5), SATB1 silenced (bar 2 and 8), SATB1 overexpressed (bars 3 and 7), and β-catenin silenced (bars 4 and 8) TH0 and TH2 cells. Fold changes were calculated with respect to the scrambled RNA transfected TH0 subset in which the GATA-3 expression level was set to baseline (bar 1). Each error bar represents standard deviation calculated from triplicates. Lower panels depict the corresponding transcript profile of SATB1, β-catenin, and β-actin in TH0 and TH2 cells upon knockdowns and overexpression, respectively. (C, D) Quantitation of TH2 cytokines Il-4, IL-10, and IL-13 in culture supernatants harvested from TH cells grown for 72 h in the presence or absence of Dkk1 (C) or upon transfection of siSATB1 and siβ-catenin (D) was performed using a multiplex bead array reader as described in Materials and Methods. The expression of the indicated TH2 cytokines is presented in pg/ml, and each error bar represents standard deviation calculated from triplicates.
Figure 8
Figure 8. Recruitment of β-catenin and p300 by SATB1 at its binding site in GATA-3 promoter is Wnt-dependent.
(A) SATB1 recruits β-catenin at the SBS within GATA-3 promoter. Naïve CD4+ T cells were differentiated to TH2 subtype by adding IL-4 for 24, 48, and 72 h in the presence or absence of siSATB1 or scrambled RNA (Scr) as described in Materials and Methods. Occupancy of the GATA-3 promoter by SATB1 and β-catenin during TH2 differentiation was monitored by quantitative real-time PCR of the SBS (upper graph) and an upstream non-SBS region (lower graph) using chromatin immunoprecipitated from ex vivo differentiated TH cells as described in Materials and Methods. Data represent relative occupancy of ChIP products as compared to the corresponding IgG controls, after normalizing for the input chromatin. Each error bar depicts standard deviation calculated from triplicates. (B) Naïve CD4+ T cells were differentiated to TH2 subtype by adding IL-4 for 72 h in the presence or absence of the Wnt inhibitor Dkk1 as described in Materials and Methods. Differential occupancy of the GATA-3 promoter by SATB1, β-catenin, and p300 during TH2 differentiation was monitored by quantitative real-time PCR of the SBS (upper graph) and an upstream non-SBS regions (lower graph) using chromatin immunoprecipitated from ex vivo differentiated TH cells. Vehicle (1×PBS) treated cells were used as controls. The occupancy of these three proteins on the two selected regions within GATA-3 promoter was determined in TH0 and TH2 subsets. Data represent relative occupancy of ChIP products as compared to the corresponding IgG controls, after normalizing for the input chromatin. Error bars depict standard deviation calculated from triplicates. Insets depict schematic representation of the upstream 2 kb region of the GATA-3 promoter showing relative positions of the SBS (star) and non-SBS (circle). Arrows depict positions of regions corresponding to which PCR primers were designed.

Similar articles

Cited by

References

    1. Logan C. Y, Nusse R. The Wnt signaling pathway in development and disease. Annu Rev Cell Dev Biol. 2004;20:781–810. - PubMed
    1. Staal F. J, Clevers H. C. Wnt signaling in the thymus. Curr Opin Immunol. 2003;15:204–208. - PubMed
    1. Itoh K, Krupnik V. E, Sokol S. Y. Axis determination in Xenopus involves biochemical interactions of axin, glycogen synthase kinase 3 and beta-catenin. Curr Biol. 1998;8:591–594. - PubMed
    1. Liu C, Kato Y, Zhang Z, Do V. M, Yankner B. A, et al. Beta-Trcp couple beta-catenin phosphorylation-degradation and regulates Xenopus axis formation. Proc Natl Acad Sci U S A. 1999;96:6273–6278. - PMC - PubMed
    1. Staal F. J. T, Vaan Noort M, Strous G. J, Clevers H. C. Wnt signals are transmitted through its N-terminally dephosphorylated beta-catenin. EMBO Rep. 2002;3:63–68. - PMC - PubMed

Publication types

MeSH terms