. 2010 Jan 26;8(1):e1000287.
doi: 10.1371/journal.pbio.1000287.

A mitotic phosphorylation feedback network connects Cdk1, Plk1, 53BP1, and Chk2 to inactivate the G(2)/M DNA damage checkpoint

Affiliations

A mitotic phosphorylation feedback network connects Cdk1, Plk1, 53BP1, and Chk2 to inactivate the G(2)/M DNA damage checkpoint

Marcel A T M van Vugt et al. PLoS Biol. .

Abstract

DNA damage checkpoints arrest cell cycle progression to facilitate DNA repair. The ability to survive genotoxic insults depends not only on the initiation of cell cycle checkpoints but also on checkpoint maintenance. While activation of DNA damage checkpoints has been studied extensively, molecular mechanisms involved in sustaining and ultimately inactivating cell cycle checkpoints are largely unknown. Here, we explored feedback mechanisms that control the maintenance and termination of checkpoint function by computationally identifying an evolutionary conserved mitotic phosphorylation network within the DNA damage response. We demonstrate that the non-enzymatic checkpoint adaptor protein 53BP1 is an in vivo target of the cell cycle kinases Cyclin-dependent kinase-1 and Polo-like kinase-1 (Plk1). We show that Plk1 binds 53BP1 during mitosis and that this interaction is required for proper inactivation of the DNA damage checkpoint. 53BP1 mutants that are unable to bind Plk1 fail to restart the cell cycle after ionizing radiation-mediated cell cycle arrest. Importantly, we show that Plk1 also phosphorylates the 53BP1-binding checkpoint kinase Chk2 to inactivate its FHA domain and inhibit its kinase activity in mammalian cells. Thus, a mitotic kinase-mediated negative feedback loop regulates the ATM-Chk2 branch of the DNA damage signaling network by phosphorylating conserved sites in 53BP1 and Chk2 to inactivate checkpoint signaling and control checkpoint duration.


Conflict of interest statement

The authors have declared that no competing interests exist.

Figures

Figure 1
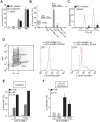
Figure 1. Inactivation of the ATM-Chk2 checkpoint signaling pathway upon mitotic entry.
(A) Asynchronous U2OS cells were untreated (“interphase”) or treated with nocodazole (“mitosis”) for 16 h and collected by shake-off. Where indicated, cells were irradiated with 10 Gy and harvested 30 min later. Whole cell lysates were immunoblotted for total and Ser-1981 phosphorylated ATM. (B) Cell lysates prepared as in panel A were immunoblotted with the indicated total and phospho-specific antibodies. (C) Lysates as in panel B were analyzed for Chk2 kinase activity using an IP/kinase assay. Error bars indicate SEM.
Figure 2
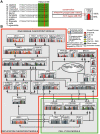
Figure 2. Conservation of mapped phosphorylation sites in the DNA damage signaling network.
(A) Example of a conserved ATM/ATR phosphorylation motif [ST]Q in H2AX. Left: the human H2AX sequence, in which the mapped phosphorylation site was identified, was aligned with orthologous sequences from the indicated genomes. No orthologues for cow, chicken, zebrafish, or pufferfish are present in the Ensembl database. Analysis of the −5/+5 region surrounding Ser139 (green box) showed conservation of 100% (M. mulatta; C. familiaris), 87.5% (M. musculus; R. norveticus), 75% (O. anatinus), and 62.5% (X. tropicalis), leading to a mean conservation of 88.2%. Right: the site is indicated by a vertical column composed of central and flanking bars. The height of the central bar indicates the extent of conservation of the central phospho-acceptor residue among the identified orthologues (red, 100%). The height of the flanking bars indicates conservation within the 11 amino acid region surrounding the phosphosite (grey, 88.2%). (B) Phosphorylation network and evolutionary analysis for components of the DNA damage checkpoint signaling pathways. Each protein in the reconstructed network is shown as a grey box containing columns corresponding to each previously identified in vivo phosphorylation sites. The height of the bars in each column indicates the evolutionary conservation of the site amongst the vertebrates, as shown in panel A and tabulated in Table S1. The NetworKIN algorithm was used to reconstruct a network of kinases involved in these phosphorylation events, and predictions for Cyclin-dependent kinases (yellow), ATM/ATR (red), CHK1/2 (orange), and Polo-like kinase-1 (blue) are displayed. Sites known to be phosphorylated by other or unknown kinases are shown in dark and light grey, respectively. Polo-box binding sites are shown in green. Lines indicate established signaling interactions.
Figure 3
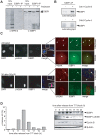
Figure 3. Cell cycle–dependent changes in post-translational modification and localization of 53BP1.
(A) Asynchronous U2OS cells were left untreated or treated with paclitaxel for 16 h and collected by shake-off. Cell lysates were used for 53BP1 immunoprecipitations and analyzed by Western blotting. Ten percent of input as well as 53BP1 immunoprecipitations were analyzed using anti-MPM-2 and anti-53BP1 antibodies. (B) Interphase U2OS cells were lysed and processed for 53BP1 immunoprecipitations. 53BP1 immunoprecipitations were subsequently used as in vitro substrates for either Cdk1-Cyclin B or Cdk2-Cyclin A. Phosphorylation of 53BP1 was analyzed by SDS-PAGE/autoradiography. (C) Asynchronously growing U2OS cells were left untreated or irradiated with 5 Gy ionizing radiation. Thirty minutes after irradiation, cells were fixed, permeabilized, and stained for 53BP1 and γ-H2AX. Magnifications represent examples of mitotic or interphase cells before or after irradiation. (D) U2OS were synchronized using a double thymidine block. At indicated time points after release, cells or cell lysates were analyzed by flow cytometry or SDS-PAGE/immunoblotting as indicated. Left panel: at each time point, 10,000 events were analyzed for phospho-Histone H3 staining by flow cytometry. Right panel: lysates prepared at indicated time points were analyzed for expression of 53BP1, phosphoSer380-53BP1, β-actin, and Cyclin B.
Figure 4
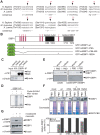
Figure 4. Interaction of 53BP1 and Plk1.
(A) Putative Polo-like kinase-1 binding sites within 53BP1 are indicated, along with site conservation across M. musculus and X. tropicalis. Asterisks mark residues that were found to be phosphorylated in vivo. (B) Schematic representation of 53BP1 protein organization along with location of putative Plk1-binding sites. Lower part: a selection of GFP-tagged murine 53BP1 constructs used in this study. Asterisks mark residues that were mutated to Ala. (C) U2OS cells were left untreated or treated with paclitaxel for 16 h, and mitotic cells were isolated by mitotic shake-off. 53BP1 was immunoprecipitated, and lysates (“input 10%”) or immunoprecipitations (“53BP1 IP”) were analyzed by Western blotting for 53BP1, Plk1, and β-actin. (D) 53BP1 was immunoprecipitated from interphase lysates and used as a substrate for Cdk1-Cyclin B or Plk1 kinase (Plk1 T210D). Incorporation of [32P]-γ-ATP was visualized by SDS-PAGE/autoradiography. (E) Interphase or mitotic lysates of U2OS cells and U2OS cells, stably expressing GFP-tagged wt-m53BP1, were incubated with immobilized GST-Plk1-PBD. Endogenous 53BP1 and GFP-tagged m53BP1 associated with GST-Plk1-PBD were analyzed by immunoblotting using anti-GFP and anti-53BP1 antibodies. “I” indicates 10% input for immunoprecipitations. “PBD” indicates pull-downs using the GST-Plk1 Polo-box domain. (F) Mitotic lysates of U2OS cell lines, stably expressing the indicated GFP-tagged m53BP1 constructs, were incubated with immobilized GST-Plk1-PBD. The inputs (“lysate”) and GST-Plk1-PBD associated 53BP1 were analyzed by immunoblotting using anti-GFP antibody. Equal loading of lysates and GST-Plk1 (a.a. 356–603) is indicated by coomassie staining. The lower graph indicates quantification of the 53BP1 signal on the Western blot. Signal was corrected for local background and input levels were set to 100%. (G) U2OS cells were left untreated of treated with nocodazole for 16 h. Nocodazole-treated mitotic cells were isolated by shake-off and, if indicated, subsequently treated with the Cdk1-inhibitor roscovitine for 30 min. Cell lysates were analyzed using anti-53BP1, anti-phospho-S376-53BP1, or anti-β-actin antibodies.
Figure 5
Figure 5. Cell cycle analysis of 53BP1-depleted cells.
Figure 6
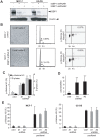
Figure 6. Phosphorylation of 53BP1 controls DNA damage checkpoint release.
(A) U2OS cells were treated for indicated time periods with DMSO, paclitaxel, or the Plk1 inhibitor BI 2536. Cells were stained using anti-phospho-Histone H3 and analyzed by FACS. Mean values and SEM from three experiments are indicated. (B) U2OS cells were left untreated or treated with 10 Gy ionizing irradiation (IR). Twelve hours after irradiation (indicated as t = 0 h), cells were left untreated or incubated with or without caffeine in the absence or presence of the Plk1 inhibitor BI 2536 for 3 or 6 h in the presence of paclitaxel to visualize cumulative mitotic entry. Phospho-Histone H3 content was measured by FACS. (C) U2OS cells were left untreated or treated with 2 Gy ionizing irradiation (IR). Thirty minutes after irradiation, cells were incubated with paclitaxel in the absence (white bars) or presence of Plk1 inhibitor (black bars). Cells were harvested at 1, 8, and 16 h after paclitaxel addition, and phospho-Histone H3 content was determined by flow cytometry. (D) U2OS were infected with wt- or S376A-EGFP-m53BP1 and, 48 h later, irradiated with 3Gy IR. Cells were harvested 12 h later, stained with anti-γ-H2AX, and analyzed by FACS. Blue lines indicate γ-H2AX levels from cells infected with retroviruses encoding wt-EGFP-m53BP1 while red lines indicate γ-H2AX levels from cells infected with retroviruses encoding S376A-EGFP-m53BP1. GFP-positive (infected) cells and GFP-negative (uninfected) cells are plotted separately. (E) U2OS cells were infected with retroviruses encoding wt-EGFP-m53BP1 or S376A-EGFP-m53BP1 and treated with paclitaxel for indicated time periods. Percentages of phospho-Histone H3-positivity within the GFP-positive cell population were analyzed by FACS. (F) U2OS cells were infected with retroviruses encoding wt-EGFP-m53BP1 or the S376A-EGFP-m53BP1 mutant and, 48 h later, irradiated with 3 Gy. Thirty minutes after irradiation, paclitaxel was added and the percentages of phospho-Histone H3-positive cells within the GFP-expressing cell populations were determined by flow cytometry at the indicated times. Mean values and SEM from three independent experiments are shown.
Figure 7
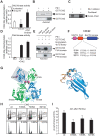
Figure 7. Inactivation of Chk2 by Plk1.
(A) U2OS cells were treated with nocodazole in the absence or presence of the Plk1-inhibitor BI 2536 for 16 h. Mitotic cells were collected using gentle shake-off and subsequently irradiated (5Gy) as indicated. Chk2 was immunoprecipitated and kinase activity was assessed by incorporation of [32P]-γ-ATP into the optimal substrate peptide (“Chk2-tide”) in an in vitro kinase assay. Means and standard deviations from three independent experiments are shown. (B) A recombinant GST fusion of full-length Chk2 was incubated with Plk1 kinase domain in the presence of [32P]-γ-ATP. Samples were analyzed by SDS-PAGE and imaged by Coomassie staining (top) and autoradiography (bottom). (C) 293T cells were transfected with FLAG-Chk2. Twenty-four hours after transfection, cells were treated with paclitaxel in combination with DMSO or in combination with Plk1 for 8 h. FLAG-Chk2 was subsequently immunoprecipitated from lysates, analyzed by SDS page, and imaged by staining. (D) Following in vitro phosphorylation by Plk1 as in panel B, the kinase activity of Chk2 was measured by the incorporation of [32P]-γ-ATP into the optimal substrate peptide (“Chk2-tide”). A reaction containing Plk1 but lacking Chk2 is shown as a control. Data are normalized to the amount of Chk2tide phosphorylation observed for Chk2 alone. (E) The Chk2 FHA domain, prior to or following phosphorylation by Plk1 in the presence of [32P]-γ-ATP, was incubated with a biotinylated phosphothreonine peptide library bound to streptavidin beads. Input (10%) and bead-bound material was analyzed by SDS-PAGE and immunoblotting with anti-GST, or by autoradiography to assess phosphorylation state. (F) Schematic representation of human Chk2. Evolutionarily conserved phosphorylation sites in the FHA domain that match the optimal Plk1 consensus motif and were identified following in vitro phosphorylation by mass spectrometry are indicated. (G) A structural basis for Plk1-mediated inactivation of Chk2. Left panel: The near full-length Chk2 dimer is shown in ribbons representation, with monomers colored green and cyan. Residues phosphorylated by Plk1 are shown in space filling representation. Right panel: The isolated Chk2 FHA domain∶phosphopeptide complex, shown in the same orientation as the boxed region in the left panel. The phospho-threonine peptide ligand and the modeled side chain of phospho-Ser-164 are shown in stick representation with phosphates colored purple. (H) U2OS cells were transfected with the indicated pIRES2-Chk2 plasmids co-expressing GFP. Cells were fixed and stained with PI and an anti-phospho-HistoneH3 antibody. GFP-positive cells were gated and the corresponding DNA profiles and percentages of phospho-HistoneH3-positive cells are indicated on the lower panels. (I) U2OS cells were treated as in panel H. Cells were left untreated for 48 h or irradiated (3Gy) and subsequently treated with paclitaxel for 24 h. Percentage of GFP-positive cells that are phosphoHistoneH3 positive at 24 h after irradiation are shown. Averages and standard errors of two experiments are shown.
Figure 8
Figure 8. A model for mitotic checkpoint inactivation.
One model for checkpoint inactivation at the G2-M transition. Left panel: DNA lesions promote the formation of protein complexes, including 53BP1 and Chk2, that mediate checkpoint function and promote DNA repair. Green symbols indicate active kinases. Right panel: (1) To terminate the ATM-Chk2 branch of the G2/M checkpoint, CyclinB/Cdk1 phosphorylates DNA damage signaling proteins, including 53BP1. (2) Cdk1 phosphorylation of 53BP1 creates a Plk1 PBD docking site, leading to Plk1 recruitment, phosphorylation of checkpoint components, and inactivation of the Chk2 FHA domain. (3) These combined phosphorylation events by mitotic kinases drive cell cycle reentry and prevent further DNA damage checkpoint activation during mitosis.

Similar articles

Cited by

References

    1. Hoeijmakers J. H. Genome maintenance mechanisms for preventing cancer. Nature. 2001;411:366–374. - PubMed
    1. Bartek J, Lukas J. DNA damage checkpoints: from initiation to recovery or adaptation. Curr Opin Cell Biol. 2007;19:238–245. - PubMed
    1. Harper J. W, Elledge S. J. The DNA damage response: ten years after. Mol Cell. 2007;28:739–745. - PubMed
    1. Kastan M. B, Bartek J. Cell-cycle checkpoints and cancer. Nature. 2004;432:316–323. - PubMed
    1. Shiloh Y. ATM and related protein kinases: safeguarding genome integrity. Nat Rev Cancer. 2003;3:155–168. - PubMed

Publication types

MeSH terms

Substances