. 2010 Feb 2;8(2):e1000302.
doi: 10.1371/journal.pbio.1000302.

Regulatory T cells and human myeloid dendritic cells promote tolerance via programmed death ligand-1

Affiliations

Regulatory T cells and human myeloid dendritic cells promote tolerance via programmed death ligand-1

Shoba Amarnath et al. PLoS Biol. .

Abstract

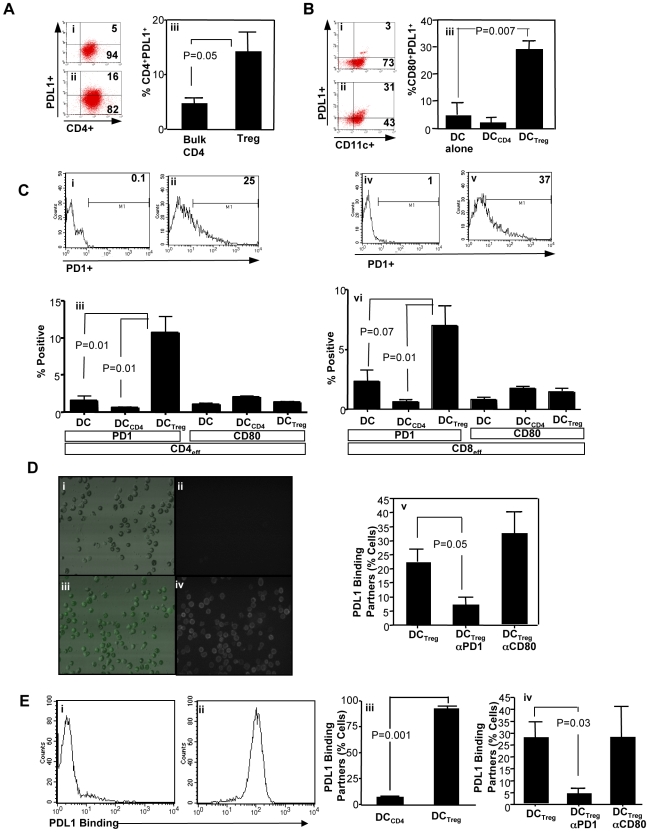
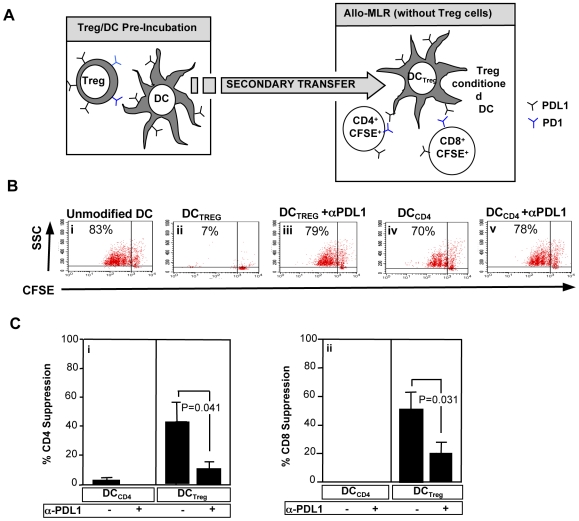
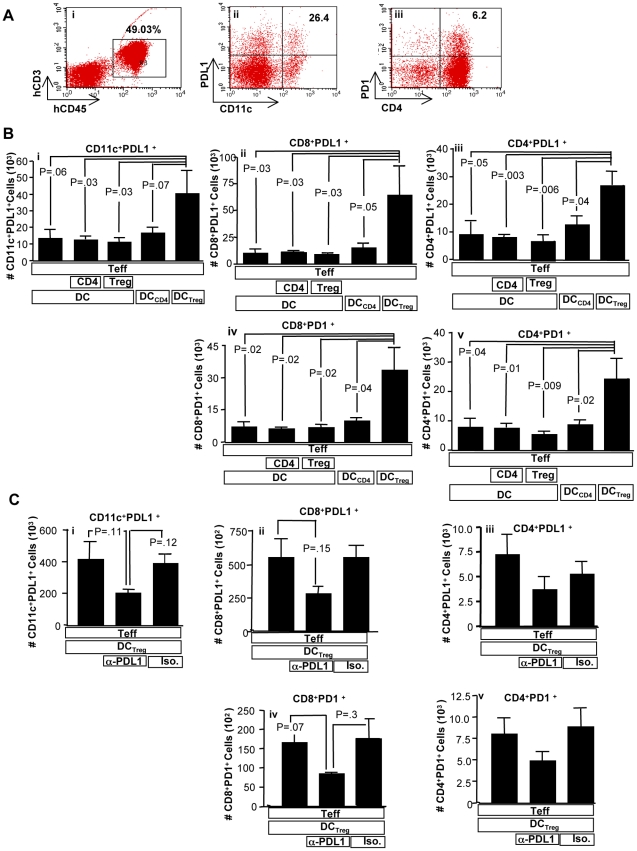
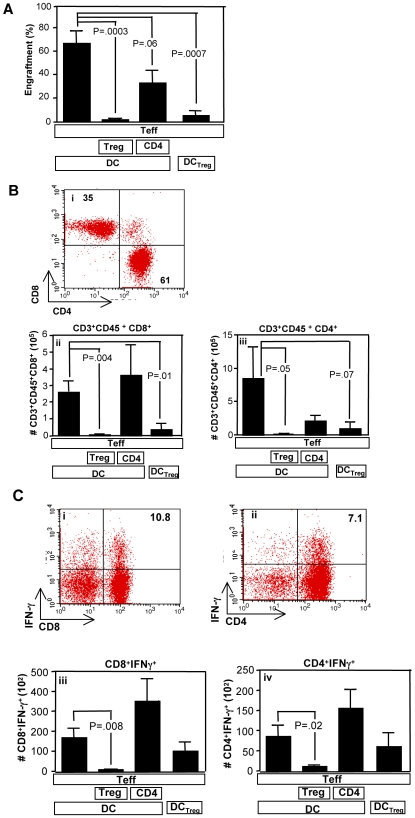
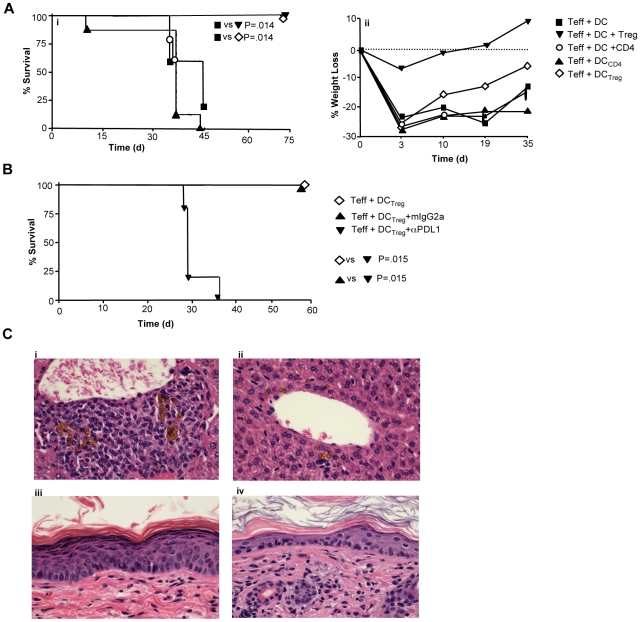
Immunotherapy using regulatory T cells (Treg) has been proposed, yet cellular and molecular mechanisms of human Tregs remain incompletely characterized. Here, we demonstrate that human Tregs promote the generation of myeloid dendritic cells (DC) with reduced capacity to stimulate effector T cell responses. In a model of xenogeneic graft-versus-host disease (GVHD), allogeneic human DC conditioned with Tregs suppressed human T cell activation and completely abrogated posttransplant lethality. Tregs induced programmed death ligand-1 (PD-L1) expression on Treg-conditioned DC; subsequently, Treg-conditioned DC induced PD-L1 expression in vivo on effector T cells. PD-L1 blockade reversed Treg-conditioned DC function in vitro and in vivo, thereby demonstrating that human Tregs can promote immune suppression via DC modulation through PD-L1 up-regulation. This identification of a human Treg downstream cellular effector (DC) and molecular mechanism (PD-L1) will facilitate the rational design of clinical trials to modulate alloreactivity.


Conflict of interest statement

The authors have declared that no competing interests exist.

Figures

Figure 1
Figure 1. Tregs express PD-L1 and modulate the PD-1 pathway.
(A) Representative flow data for control CD4 cell and Treg expression of PDL1 ((i) and (ii), respectively). (iii) represents summation of results (mean ± SEM of n = 4 experiments). (B) Control CD4 cells and Tregs were cocultured with pooled allogeneic DC for 24 h (Treg to DC ratio, 1∶1) to generate “DCCD4” and “DCTreg” populations, respectively. Control CD4 cells and Tregs were then removed and resultant conditioned DC were evaluated for coexpression of CD80 and PD-L1. Representative data for DCCD4 and DCTreg conditions are shown in (i) and (ii), respectively. (iii) represents summation of results (mean ± SEM of n = 5 experiments). (C) Flow cytometry detection of the PD-L1 binding partners PD1 and CD80 on effector CD4+ cells ((i), (ii), and (iii)) and CD8+ cells ((iv), (v), and (vi)) after exposure to control or conditioned allogeneic DC for 48 h. Representative histograms showing isotype control (i) and PD1 staining of CD4 effectors (ii); (iii) represents summation of CD4 cell results (mean ± SEM of n = 3 experiments). Similarly, representative histograms showing isotype control (iv) and PD1 expression of CD8 effectors (v); (vi) represents summation of CD8 cell results (mean ± SEM of n = 3 experiments). (D) Laser scanning cytometry for detection of PD-L1 binding partners on both CD4+ and CD8+ responder T cells. Enriched responders were incubated with a PD-L1 fusion protein. Pseudocolor and fluorescence images of PD-L1 binding to responder T cells stimulated with control CD4 cell–conditioned DC are shown in (i) and (ii), respectively; pseudocolor and fluorescence images of PD-L1 binding to responder T cells stimulated with Treg-conditioned DC are shown in (iii) and (iv), respectively. Blocking studies were performed to determine PD-L1 receptor usage: enriched responders were blocked with anti-PD1 or anti-CD80 and then incubated with PD-L1 fusion protein (v). (E) Responder T cell binding of PD-L1 fusion protein by flow cytometry. Allo-MLR was established using control CD4- or Treg-conditioned DC. After 48 h, responder T cells were harvested, stained with PD-L1 fusion protein, and flow cytometry was performed. Representative flow histograms show responder T cell PD-L1 binding using control CD4-conditioned DC (i) or Treg-conditioned DC (ii). Pooled results from n = 3 normal donors are shown in (iii) (% of cells binding PDL-1; mean ± SEM); (iv) shows blocking studies for n = 3 donors in an independent experiment (% of cells binding PD-L1; mean ± SEM).
Figure 2
Figure 2. Treg-conditioned DC have reduced allostimulatory function in part through PD-L1.
(A) Experimental schema for the allo-MLR using Treg-conditioned DC. Control CD4 cells or Tregs were generated ex vivo and then utilized to condition allogeneic DC (24-h incubation; 1∶1 cell ratio). Conditioned DC were then purified by negative selection using anti-CD3 microbeads and utilized as the stimulator population (DC to responder T cell ratio, 1∶20). The allo-MLR was performed in the presence of anti-PD-L1 or isotype control antibody. (B) Representative CFSE dye dilution proliferation assay results, including responder CD4 alloreactivity in response to: unmodified DC (i); DC conditioned with Tregs either without (ii) or with (iii) addition of anti–PD-L1; and DC conditioned with control CD4 cells either without (iv) or with (v) anti–PD-L1. (C) Percent inhibition of responder CD4 cell proliferation (i) and responder CD8 cell proliferation (ii) were calculated relative to proliferation measured using sham-treated DC. Results are mean ± SEM of n = 8 normal donors evaluated.
Figure 3
Figure 3. Treg-conditioned DC modulate effector T cells in vivo via PD-L1.
A xenogeneic transplantation model utilized Rag2−/−γc−/− mice that received some combination of human cells, as indicated, including: CFSE-labeled effector Teff cells (“Teff”); untreated DC (“DC”), control CD4-conditioned DC (“DCCD4”), or Treg-conditioned DC (“DCTreg”); and ex vivo–generated control CD4 cells (“CD4”) or regulatory T cells (“Treg”). (A) Spleens were harvested 24 h after cell infusion and analyzed by flow cytometry. Human cells were gated by human CD45+ staining including any human CD3+ T cells (representative data; (i)). PDL1 expression was evaluated on DC by CD11c staining (representative data, (ii)); PD1 expression was evaluated on CD4 cells (representative data, (iii)). (B) Flow cytometric analysis was used to measure the absolute number of: CD11c+ DC that coexpressed PD-L1 (i); CD8+ and CD4+ T cells that coexpressed PD-L1 ((ii) and (iii), respectively); and CD8+ and CD4+ T cells that coexpressed PD-1 ((iv) and (v), respectively). Results are mean ± SEM of n = 5 mice per cohort. (C) In a separate experiment, control CD4-conditioned or Treg-conditioned DC were incubated for 30 min with anti–PD-L1 or isotype control antibody prior to adoptive transfer; in addition, anti–PD-L1 or isotype control antibody was injected intraperitoneally immediately after cell transfer (100 µg/mouse). Spleens were harvested 24 h after cell infusion and analyzed by flow cytometry to determine the absolute number of: CD11c+ DC that coexpressed PD-L1 (i); CD8+ and CD4+ T cells that coexpressed PD-L1 ((ii) and (iii), respectively); and CD8+ and CD4+ T cells that coexpressed PD-1 ((iv) and (v), respectively). Results are mean ± SEM of n = 5 mice per cohort.
Figure 4
Figure 4. Reduction in human effector T cell numbers in vivo by Tregs or Treg-conditioned DC.
Rag2−/−γc−/− mice were reconstituted with human cells, as indicated, including: effector Th1/Tc1 cells (“Teff”); untreated DC (“DC”) or Treg-conditioned DC (“DCTreg”); and ex vivo–generated control CD4 cells (“CD4”) or regulatory T cells (“Treg”). Teff, DC, and Treg doses were 1×10⁷, 0.5×10⁶, and 0.5×10⁶ cells per recipient, respectively. One additional cohort received Teff cells in combination with control CD4-conditioned DC; this cohort is not shown because of early posttransplant lethality due to xenogeneic GVHD. (A) Spleens were harvested on day 45 posttransplant and percent human cell engraftment was determined by flow cytometry. (B) Representative flow data of human CD4+ and CD8+ T cell engraftment (i). Summation data for the absolute number of human CD8+ T cells engrafted in the spleen (ii) and human CD4+ T cells engrafted in the spleen (iii). (C) At day 45 posttransplant, splenocytes were costimulated for 24 h, and IC flow cytometry was performed to detect human CD4+ and CD8+ T cells capable of IFN-γ secretion. Representative flow results are shown in (i) and (ii). Summation results for determination of the absolute number of human CD4+IFN-γ+ cells and CD8+IFN-γ+ cells per spleen are shown in (iii) and (iv), respectively. All results are mean ± SEM for n = 5 mice per cohort.
Figure 5
Figure 5. Tregs or Treg-conditioned DC protect against lethal xenogeneic GVHD.
Using Rag2−/−γc−/− mice as host, transplant cohorts received effector T cells (“Teff”) in combination with allogeneic DC, control CD4 cell-conditioned DC (“DCCD4”), or Treg-conditioned DC (“DCTreg”); other cohorts received Teff cells in combination with allogeneic DC plus either Tregs (“Treg”) or control CD4 cells (“CD4”). The doses of the Teff, DC, and Treg cells were 3×10⁷, 3.0×10⁶, and 1.5×10⁶ cells per recipient, respectively. (A) Overall survival is shown in (i); posttransplant weight loss is shown in (ii). (B) In an independent experiment, transplants were performed at these same cell doses, and posttransplant survival was determined. Treg-conditioned DC were incubated with anti–PD-L1 (“αPDL1”) or isotype control antibody (“mIgG2a”) for 30 min prior to adoptive transfer; in addition, anti–PD-L1 or isotype control antibody was injected i.p. immediately after cell transfer (100 µg/mouse). (C) Representative result of histology analysis performed at day 30 posttransplant demonstrates T cell infiltration of liver in the GVHD control group (i) and minimal infiltration in recipients of Tregs (ii). Representative histology of skin demonstrates cutaneous acanthosis and hyperkeratosis in GVHD controls (iii) and minimal skin pathology in recipients of Tregs (iv).

Similar articles

Cited by

References

    1. Sakaguchi S, Ono M, Setoguchi R, Yagi H, Hori S, et al. Foxp3+ CD25+ CD4+ natural regulatory T cells in dominant self-tolerance and autoimmune disease. Immunol Rev. 2006;212:8–27. - PubMed
    1. Brunkow M. E, Jeffery E. W, Hjerrild K. A, Paeper B, Clark L. B, et al. Disruption of a new forkhead/winged-helix protein, scurfin, results in the fatal lymphoproliferative disorder of the scurfy mouse. Nat Genet. 2001;27:68–73. - PubMed
    1. Bennett C. L, Christie J, Ramsdell F, Brunkow M. E, Ferguson P. J, et al. The immune dysregulation, polyendocrinopathy, enteropathy, X-linked syndrome (IPEX) is caused by mutations of FOXP3. Nat Genet. 2001;27:20–21. - PubMed
    1. Kumar V, Stellrecht K, Sercarz E. Inactivation of T cell receptor peptide-specific CD4 regulatory T cells induces chronic experimental autoimmune encephalomyelitis (EAE). J Exp Med. 1996;184:1609–1617. - PMC - PubMed
    1. Tang Q, Henriksen K. J, Bi M, Finger E. B, Szot G, et al. In vitro-expanded antigen-specific regulatory T cells suppress autoimmune diabetes. J Exp Med. 2004;199:1455–1465. - PMC - PubMed

Publication types