Priming immunization with DNA augments immunogenicity of recombinant adenoviral vectors for both HIV-1 specific antibody and T-cell responses
- PMID: 20126394
- PMCID: PMC2814848
- DOI: 10.1371/journal.pone.0009015
Priming immunization with DNA augments immunogenicity of recombinant adenoviral vectors for both HIV-1 specific antibody and T-cell responses
Abstract
Background: Induction of HIV-1-specific T-cell responses relevant to diverse subtypes is a major goal of HIV vaccine development. Prime-boost regimens using heterologous gene-based vaccine vectors have induced potent, polyfunctional T cell responses in preclinical studies.
Methods: The first opportunity to evaluate the immunogenicity of DNA priming followed by recombinant adenovirus serotype 5 (rAd5) boosting was as open-label rollover trials in subjects who had been enrolled in prior studies of HIV-1 specific DNA vaccines. All subjects underwent apheresis before and after rAd5 boosting to characterize in depth the T cell and antibody response induced by the heterologous DNA/rAd5 prime-boost combination.
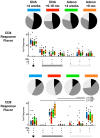
Results: rAd5 boosting was well-tolerated with no serious adverse events. Compared to DNA or rAd5 vaccine alone, sequential DNA/rAd5 administration induced 7-fold higher magnitude Env-biased HIV-1-specific CD8(+) T-cell responses and 100-fold greater antibody titers measured by ELISA. There was no significant neutralizing antibody activity against primary isolates. Vaccine-elicited CD4(+) and CD8(+) T-cells expressed multiple functions and were predominantly long-term (CD127(+)) central or effector memory T cells and that persisted in blood for >6 months. Epitopes mapped in Gag and Env demonstrated partial cross-clade recognition.
Conclusion: Heterologous prime-boost using vector-based gene delivery of vaccine antigens is a potent immunization strategy for inducing both antibody and T-cell responses.
Trial registration: ClinicalTrials.gov NCT00102089, NCT00108654.
Conflict of interest statement
Figures


Similar articles
-
Safety and Immunogenicity of a rAd35-EnvA Prototype HIV-1 Vaccine in Combination with rAd5-EnvA in Healthy Adults (VRC 012).PLoS One. 2016 Nov 15;11(11):e0166393. doi: 10.1371/journal.pone.0166393. eCollection 2016. PLoS One. 2016. PMID: 27846256 Free PMC article. Clinical Trial.
-
A phase 1/2 study of a multiclade HIV-1 DNA plasmid prime and recombinant adenovirus serotype 5 boost vaccine in HIV-Uninfected East Africans (RV 172).J Infect Dis. 2010 Feb 15;201(4):600-7. doi: 10.1086/650299. J Infect Dis. 2010. PMID: 20078213 Free PMC article. Clinical Trial.
-
Safety and immunogenicity study of Multiclade HIV-1 adenoviral vector vaccine alone or as boost following a multiclade HIV-1 DNA vaccine in Africa.PLoS One. 2010 Sep 21;5(9):e12873. doi: 10.1371/journal.pone.0012873. PLoS One. 2010. PMID: 20877623 Free PMC article. Clinical Trial.
-
Clinical experience with plasmid DNA- and modified vaccinia virus Ankara-vectored human immunodeficiency virus type 1 clade A vaccine focusing on T-cell induction.J Gen Virol. 2007 Jan;88(Pt 1):1-12. doi: 10.1099/vir.0.82493-0. J Gen Virol. 2007. PMID: 17170430 Review.
-
Novel adenovirus vector-based vaccines for HIV-1.Curr Opin HIV AIDS. 2010 Sep;5(5):386-90. doi: 10.1097/COH.0b013e32833cfe4c. Curr Opin HIV AIDS. 2010. PMID: 20978378 Free PMC article. Review.
Cited by
-
Novel directions in HIV-1 vaccines revealed from clinical trials.Curr Opin HIV AIDS. 2013 Sep;8(5):421-31. doi: 10.1097/COH.0b013e3283632c26. Curr Opin HIV AIDS. 2013. PMID: 23743791 Free PMC article. Review.
-
Synthetic DNA vaccine strategies against persistent viral infections.Expert Rev Vaccines. 2013 May;12(5):537-54. doi: 10.1586/erv.13.33. Expert Rev Vaccines. 2013. PMID: 23659301 Free PMC article. Review.
-
HIV/AIDS Vaccines: 2018.Clin Pharmacol Ther. 2018 Dec;104(6):1062-1073. doi: 10.1002/cpt.1208. Epub 2018 Oct 9. Clin Pharmacol Ther. 2018. PMID: 30099743 Free PMC article. Review.
-
Post-translational intracellular trafficking determines the type of immune response elicited by DNA vaccines expressing Gag antigen of Human Immunodeficiency Virus Type 1 (HIV-1).Hum Vaccin Immunother. 2013 Oct;9(10):2095-102. doi: 10.4161/hv.26009. Epub 2013 Aug 13. Hum Vaccin Immunother. 2013. PMID: 23941868 Free PMC article.
-
Clinical development of a novel CD1d-binding NKT cell ligand as a vaccine adjuvant.Clin Immunol. 2011 Aug;140(2):142-51. doi: 10.1016/j.clim.2010.11.009. Epub 2010 Dec 24. Clin Immunol. 2011. PMID: 21185784 Free PMC article. Review.
References
-
- Pantaleo G, Koup RA. Correlates of immune protection in HIV-1 infection: what we know, what we don't know, what we should know. Nat Med. 2004;10:806–810. - PubMed
-
- Plotkin SA. Vaccines: correlates of vaccine-induced immunity. Clin Infect Dis. 2008;47:401–409. - PubMed
-
- Mascola JR, Snyder SW, Weislow OS, Belay SM, Belshe RB, et al. Immunization with envelope subunit vaccine products elicits neutralizing antibodies against laboratory-adapted but not primary isolates of human immunodeficiency virus type 1. The National Institute of Allergy and Infectious Diseases AIDS Vaccine Evaluation Group. J Infect Dis. 1996;173:340–348. - PubMed
-
- Burton DR, Desrosiers RC, Doms RW, Koff WC, Kwong PD, et al. HIV vaccine design and the neutralizing antibody problem. Nat Immunol. 2004;5:233–236. - PubMed
-
- Flynn NM, Forthal DN, Harro CD, Judson FN, Mayer KH, et al. Placebo-controlled phase 3 trial of a recombinant glycoprotein 120 vaccine to prevent HIV-1 infection. J Infect Dis. 2005;191:654–665. - PubMed
Publication types
MeSH terms
Substances
Associated data
Grants and funding
LinkOut - more resources
Full Text Sources
Other Literature Sources
Medical
Research Materials

