. 2010 Jan 29;5(1):e8960.
doi: 10.1371/journal.pone.0008960.

SOX2 is an oncogene activated by recurrent 3q26.3 amplifications in human lung squamous cell carcinomas

Affiliations

SOX2 is an oncogene activated by recurrent 3q26.3 amplifications in human lung squamous cell carcinomas

Thomas Hussenet et al. PLoS One. .

Abstract

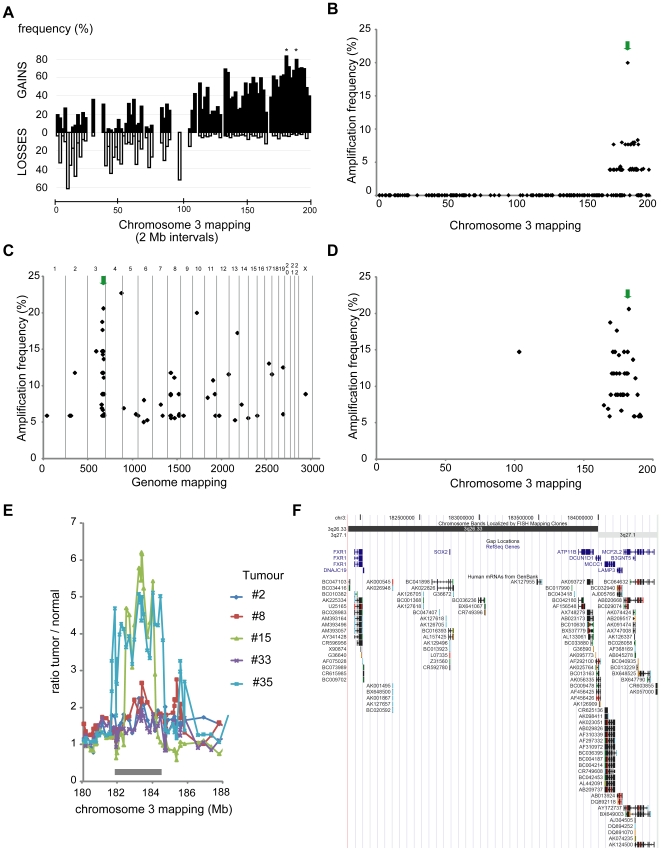
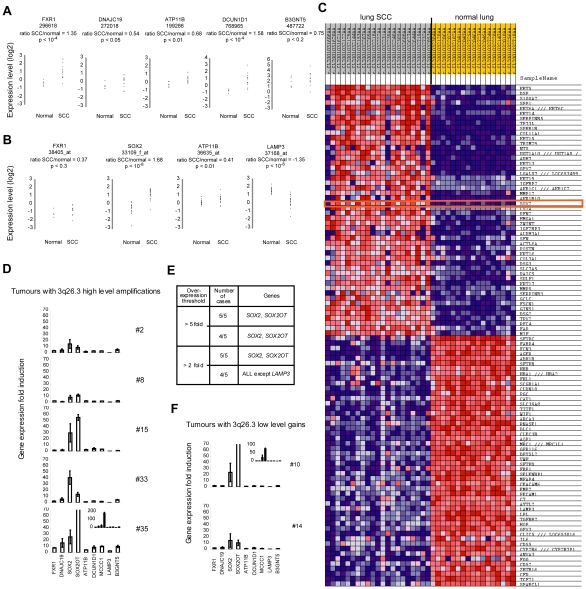
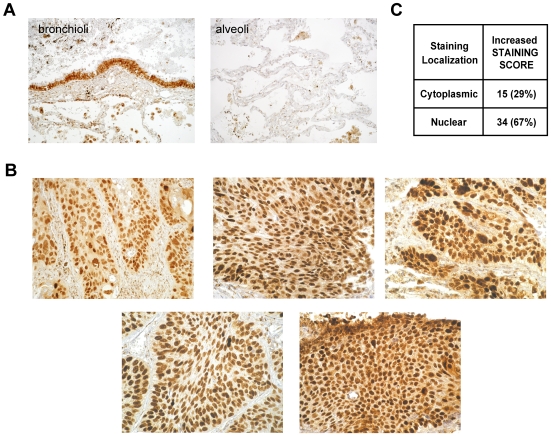
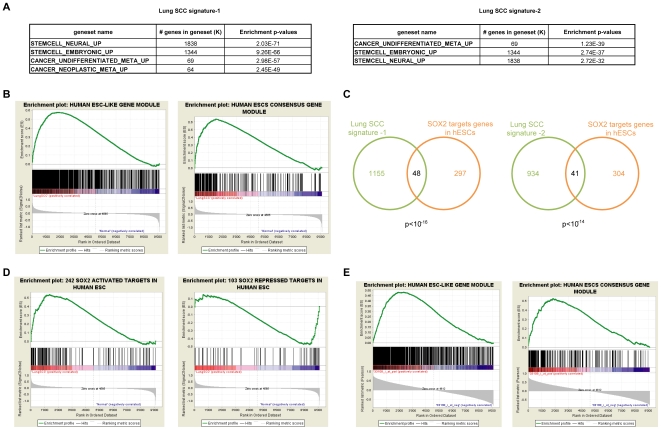
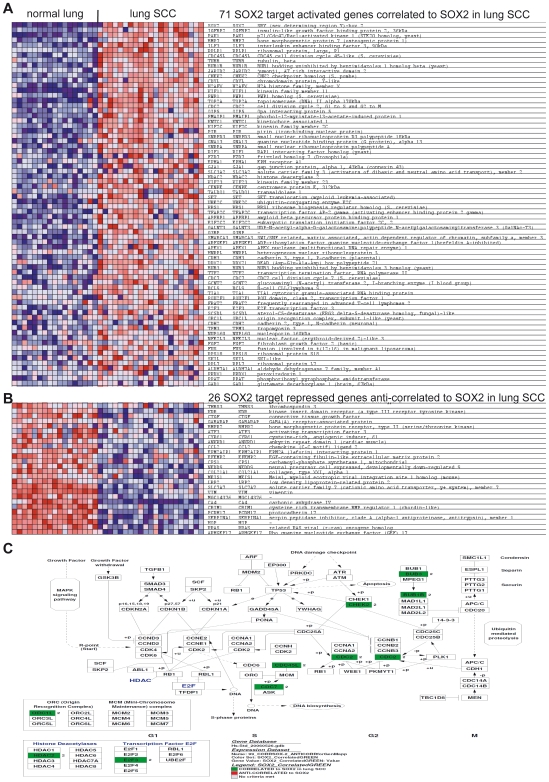
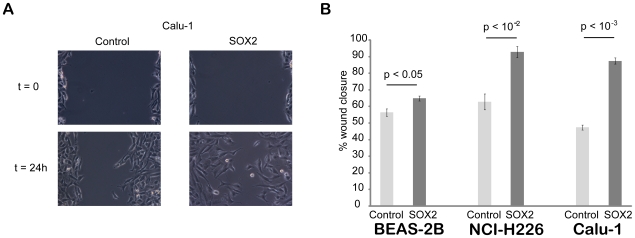
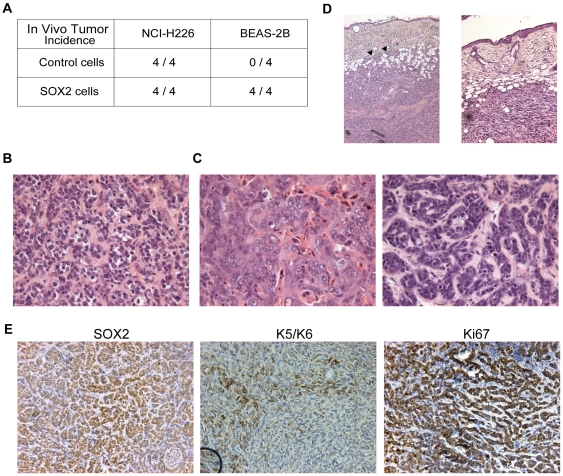
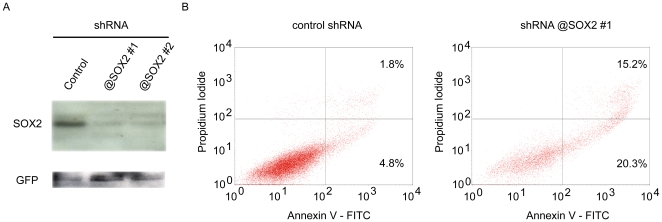
Squamous cell carcinoma (SCC) of the lung is a frequent and aggressive cancer type. Gene amplifications, a known activating mechanism of oncogenes, target the 3q26-qter region as one of the most frequently gained/amplified genomic sites in SCC of various types. Here, we used array comparative genomic hybridization to delineate the consensus region of 3q26.3 amplifications in lung SCC. Recurrent amplifications occur in 20% of lung SCC (136 tumors in total) and map to a core region of 2 Mb (Megabases) that encompasses SOX2, a transcription factor gene. Intense SOX2 immunostaining is frequent in nuclei of lung SCC, indicating potential active transcriptional regulation by SOX2. Analyses of the transcriptome of lung SCC, SOX2-overexpressing lung epithelial cells and embryonic stem cells (ESCs) reveal that SOX2 contributes to activate ESC-like phenotypes and provide clues pertaining to the deregulated genes involved in the malignant phenotype. In cell culture experiments, overexpression of SOX2 stimulates cellular migration and anchorage-independent growth while SOX2 knockdown impairs cell growth. Finally, SOX2 over-expression in non-tumorigenic human lung bronchial epithelial cells is tumorigenic in immunocompromised mice. These results indicate that the SOX2 transcription factor, a major regulator of stem cell function, is also an oncogene and a driver gene for the recurrent 3q26.33 amplifications in lung SCC.


Conflict of interest statement

Competing Interests: The authors have declared that no competing interests exist.

Figures

Figure 1
Figure 1. Characterization of chromosome 3 aberrations in lung SCC using array-CGH.
A. Frequency of chromosome 3 losses and gains in 26 advanced lung SCCs. For each 2 Mb interval along chromosome 3, frequencies were calculated by dividing the total number of occurrences of losses or gains observed in the series by the total number of possible occurrences, expressed as percentages and represented along the chromosomal order. Gaps are due to intervals with no coverage on the array. Frequent 3p losses seem to affect discontinuous zones. The most frequently lost region is the 8–10 Mb interval (around 60% of samples). Gains were more frequently detected on the 3q arm: 3q26-qter was gained in 50–60% of the samples with two discrete intervals (180–182 and 188–190 Mb, denoted by asterisks) gained in around 80% of tumors. B. High level chromosome 3 amplification frequency in 26 advanced lung SCCs. For a given clone, a ratio greater than 2 (1 in log2 scale) in a single experiment was considered to represent a high-level amplification. Frequencies were calculated for the series of 26 cases and plotted according to clone localization. High level amplifications cluster in the 3q26-qter region. A peak maxima is observed for BAC clone RP11-259I19; high level amplifications of this locus are found in 20% of cases (5/26 tumors). C. Whole genome high level amplification frequencies in 34 advanced lung SCCs (independent cohort). Chromosome numbers are indicated above the graph, and different chromosomes are separated by vertical gray lines. For a given clone, a ratio greater than 1.5 in log2 scale in a single experiment was considered to represent a high-level amplification. Frequencies were calculated for the series of 34 cases and plotted according to clone localization on the genome. Two genomic regions, on chromosomes 3 and 4 were amplified in >20% of the cases. D. High level chromosome 3 high level amplification frequency in 34 advanced lung SCCs (independent cohort). The graph corresponds to panel C restricted to chromosome 3. E. Individual array-CGH profiles obtained for the five tumors with high level 3q26.3 gene amplifications. High ratio deviations were observed for two tumors with straight amplicon boundaries (#15 and #35). The consensus region of 3q26.3 amplifications is a 2.7 Mb segment spanning the 181.9–184.6 Mb interval (denoted by a grey rectangle). F. UCSC genome browser map of the 3q26.33 consensus region of amplifications in lung SCCs. This fully sequenced and assembled genomic region (181.9–184.6 Mb, NCBI build 34) contains nine genes (Refseq), including DCUN1D1 and SOX2, and various Genbank mRNAs. This image was downloaded from the UCSC genome browser (http://genome.ucsc.edu/, [64], [65]). The green arrows in panels B and C/D point to BAC clones RPCI11-259I19 and RPCI11-701O19, respectively, corresponding to the maxima of chromosome 3 amplification in these lung SCC cohorts. RPCI11-259I19 and RPCI11-701O19 are mapped, respectively, between the SOX2 and DCUN1D1, and FXR1 and SOX2, genes. Two different clones were found due to the composition of the two arrays (RPCI11-259I19 in our Chr3 array and RPCI11-701O19 in the GSE12280 array). Mapping of the amplification by two independent clones suggest that it is not a clone-derived artifact.
Figure 2
Figure 2. Transcriptional consequences of 3q26.33 copy number increases in lung SCC.
Panels A and B: expression levels of 3q26.33 genes in lung SCCs versus normal comparisons using microarrays and Oncomine. Each graph represents normalized log2 expression values of a given gene in normal lung and lung SCC samples. The clone (panel A) or Affymetrix probe set (panel B) number is indicated under the gene name. The log2 value ratio (average expression value in SCC)/(average expression value in normal lung) and the corresponding p-value are indicated. A. Lung SCC dataset-2. Among the five genes that were analyzable and represented (FXR1, DNAJC19, ATP11B, DCUN1D1, and B3GNT5), FXR1, ATP11B, and DCUN1D1 are significantly over-expressed in lung SCCs (all with p<10−2). B. Lung SCC dataset-1. Four genes localized in the 3q26.3 core amplicon are represented on the microarray (FXR1, SOX2, ATP11B, and LAMP3). LAMP3 is strongly down-regulated in the tumors (p<10−8). ATP11B (p<10−2) and SOX2 (p<10−8) are significantly over-expressed in lung SCCs. C. Top 100 genes deregulated in lung SCC dataset-1 using GenePattern. These genes include SOX2 (red rectangle) among the top 50 genes over-expressed in lung SCCs compared to normal lung. In this dataset, four genes (FXR1, SOX2, ATP11B, and LAMP3) out of the nine localized in the core amplicon were represented on the array. For each gene in each sample, expression is represented by a square with a color that codes for the level as a gradient (dark blue, low expression, to dark red, strong expression). D. Expression levels of nine genes from the consensus region in the tumors with high level 3q26.3 amplifications. The identical y-scale for all graphs represents the expression ratio for a given gene when compared to its relative average expression level in two lung SCCs without copy number change of the 3q26.3 locus. Genes are ranked from left to right according to 3q26.33 genomic localization, and names are represented below the bottom graph. E. Summary of over-expressed genes in the five lung SCCs with high-level 3q26.3 amplifications. Two genes, SOX2 and SOX2OT, are consistently over-expressed in tumors with 3q26.3 copy number increases when compared to tumors with a normal copy number of the locus. Other genes are recurrently over-expressed but at lower levels when compared to SOX2 and SOX2OT. F. Two tumors with low-level copy number gains of the 3q26.3 locus were analyzed as in panel D. SOX2 and SOX2OT are the most over-expressed genes in these tumors. Panels D and F: Sample numbers are indicated on the right of the graphs. Insets in tumor #35 and #10 graphs correspond to y-axis extended scale to fold-change values of 200 and 100, respectively. Fold-changes represent the mean ± sem of three independent experiments.
Figure 3
Figure 3. SOX2 immunohistochemical analysis in 51 advanced lung SCCs.
A. Sox2 staining pattern in a normal human lung sample (left panel: bronchioli; and right panel: alveoli). SOX2 is detected at a low level in the cytoplasm of all bronchial and bronchiolar epithelial cells, and staining intensity is strong in the nucleus of 30% of these cells. Alveolar epithelial cells are negative. B. Sox2 staining in the five tumors with high-level 3q26.33 amplifications. SOX2 is strongly expressed in the nucleus of most tumor cells (>80%). C. Summary of staining scores for the 51 lung SCCs. Staining was scored according to intracellular localization (cytoplasmic or nuclear) and intensity. For each category, the number of cases is indicated, and the corresponding percentage (over the series of 51 samples) is indicated between brackets. SOX2 activation, as defined by stronger nuclear staining and detection in a higher proportion of cells when compared to normal lung epithelial cells, is observed in a wide majority of lung SCCs (67%). All pictures of tumors were acquired at 250x magnification.
Figure 4
Figure 4. A global SOX2 imprint on the lung SCC transcriptome towards an embryonic stem cell-like molecular phenotype.
A. Selected molecular signatures enriched in the lung SCC signatures −1 and −2. For each signature, enrichments were queried using the molecular signatures database. Highly significant enrichment of both embryonic and neural stem cell-specific molecular signatures was observed in the lung SCC transcriptome (all with p<10−31, hypergeometric distributions). B. Enrichments of ESC-like gene modules with known relevance for epithelial cancers in lung SCCs. The GSEA tool was used to query enrichments of the human ESC-like (left panel) and the human ESC consensus (right panels) gene modules in the lung SCC dataset-1. Significant enrichments are observed in lung SCCs (both FDR <0.02). C. Venn diagrams of the overlaps between the 345 SOX2 target genes in hESCs and the lung SCC signatures −1 (left graph) or −2 (right panel). Gene numbers are indicated within the corresponding sections, and the p-value is below each graph (hypergeometric distribution). D. Enrichments of known SOX2 target genes in lung SCCs (dataset-1). The GSEA tool was used to query enrichments of SOX2 target genes that are activated (left panel) or repressed by SOX2 (right panel) in human ESCs. Significant enrichment of SOX2-activated target genes is observed among genes over-expressed in lung SCCs (FDR <0.03) and of SOX2- repressed genes among genes under-expressed in lung SCCs (FDR  = 0.13). E. Enrichments of ESC-like gene modules with known relevance for epithelial cancers among genes correlated to SOX2 expression in lung SCCs. The GSEA tool was used to query enrichments of the human ESC-like and the human ESC consensus gene modules in the lung SCC dataset-1 using SOX2 expression to define phenotypes. Significant enrichments are observed (both FDR <0.05).
Figure 5
Figure 5. List of known direct SOX2 targets in hESCs that significantly correlate and anti-correlate to with SOX2 expression in lung SCCs.
A. The 71 genes that are known SOX2-activated target genes in human ESCs and significantly correlate with SOX2 expression in lung SCCs. B. The 26 genes that are known SOX2-repressed target genes in human ESCs and significantly anti-correlate with SOX2 expression in lung SCCs. Panels A and B: For each gene in each sample, expression is represented by a square with a color that codes for the level as a gradient (dark blue, low expression, to dark red, strong expression). C. Genmapp view of the enriched cell cycle regulators that are targets of SOX2 in hESCs and correlate with SOX2 expression in lung SCCs. Green boxes represent the genes that are significantly enriched among the known SOX2-activated target genes in human ESCs and correlate to SOX2 expression in lung SCCs.
Figure 6
Figure 6. Consequences of Sox2 over-expression in the wound healing in vitro assay.
A. Pictures were acquired at the beginning of the experiment (t = 0, immediately after wounding) and from the same field at the end of the experiment (t = 24 h for this example from the Calu-1 cell line). B. Quantification of wound closure for the three cell lines (BEAS-2B, NCI-H226 and Calu-1). Wound sizes were measured at the beginning and end of the experiment to calculate the percentage of wound closure for control and SOX2 over-expressing cells for each of the three cell lines. SOX2 over-expression significantly stimulates cell migration compared to control cells (student's t-test).
Figure 7
Figure 7. Consequences of Sox2 over-expression in vivo.
A. Tumor incidence upon subcutaneous implantation of human lung squamous control- and SOX2-transduced cell lines in nude mice. For each cell line, the number of tumors that developed is represented with respect to the number of injections for each cell type (control or SOX2-transduced, n = 4 injected animals each). Tumor incidence is unchanged for the NCI-H226 highly tumorigenic cell line, whereas BEAS-2B cells become tumorigenic upon Sox2 over-expression. B. Hematoxylin and Eosin (H&E) staining of a representative area of a BEAS-2B-Sox2 subcutaneous tumor (magnification = 100×). A majority of the tumor area (around 80%) has typical traits of poorly differentiated basaloid variants of squamous cell carcinoma. C. H&E staining of representative areas of the same BEAS-2B-Sox2 subcutaneous tumor as in panel B (magnification = 100×). Around 20% of the tumor area has typical traits of poorly to moderately differentiated squamous cell carcinoma, with individual cell keratinization. D. H&E staining of one BEAS-2B-Sox2 subcutaneous tumor (magnification = 50×). In this case, local tumor cell invasion into the dermis was observed (arrowheads). E. Immunohistochemistry for SOX2, Keratins 5/6 and Ki67 (left, middle and right panels, respectively; magnifications = 200×). Tumors homogeneously express SOX2 and Ki67 and heterogeneously express Keratins 5/6, which are squamous cell differentiation markers.
Figure 8
Figure 8. Consequences of shRNA-mediated knockdown of SOX2.
A. Western blot analysis of cells transfected with SOX2-specific shRNA-expressing plasmids. Two shRNAs were found to very efficiently knockdown SOX2 protein expression in 293T cells over-expressing SOX2 (see Materials and Methods). B. FACS analysis of AnnexinV and Propidium Iodide stained BEAS-2B cells. Control and SOX2 shRNA-transduced cells were stained to determine the proportions of cell death by FACS analysis. Proportions of early apoptotic (AnnexinV+/PI-) and late apoptotic/necrotic (AnnexinV+/PI+) cells are strikingly increased in SOX2 knockdown cells.

Similar articles

Cited by

References

    1. Albertson DG, Collins C, McCormick F, Gray JW. Chromosome aberrations in solid tumors. Nat Genet. 2003;34:369–376. - PubMed
    1. Hogarty MD, Brodeur GM. Scriver CR, Sly WS, Childs B, Beaudet AL, Valle D, Kinzler KW, Vogelstein B, editors. Gene Amplification in Human Cancers: Biological and Clinical Significance. The Metabolic & Molecular Bases of Inherited Disease, 8th edition. 2001. pp. 597–610.
    1. Albertson DG. Gene amplification in cancer. Trends Genet. 2006;22:447–455. - PubMed
    1. Gebhart E, Liehr T. Patterns of genomic imbalances in human solid tumors. Int J Oncol. 2000;162:383–399. - PubMed
    1. Balsara BR, Testa JR. Chromosomal imbalances in human lung cancer. Oncogene. 2002;21:6877–6883. - PubMed

Publication types

MeSH terms

Substances