. 2010 Jan 29;5(1):e8524.
doi: 10.1371/journal.pone.0008524.

Echinocandin treatment of pneumocystis pneumonia in rodent models depletes cysts leaving trophic burdens that cannot transmit the infection

Affiliations

Echinocandin treatment of pneumocystis pneumonia in rodent models depletes cysts leaving trophic burdens that cannot transmit the infection

Melanie T Cushion et al. PLoS One. .

Abstract

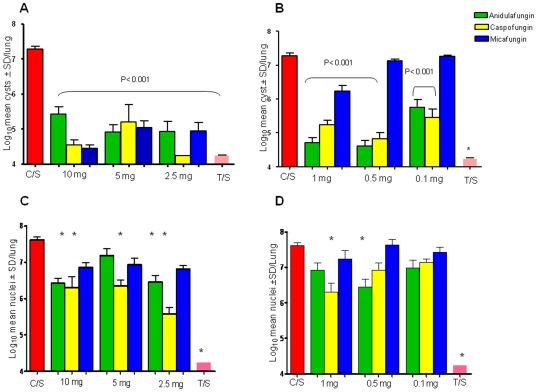
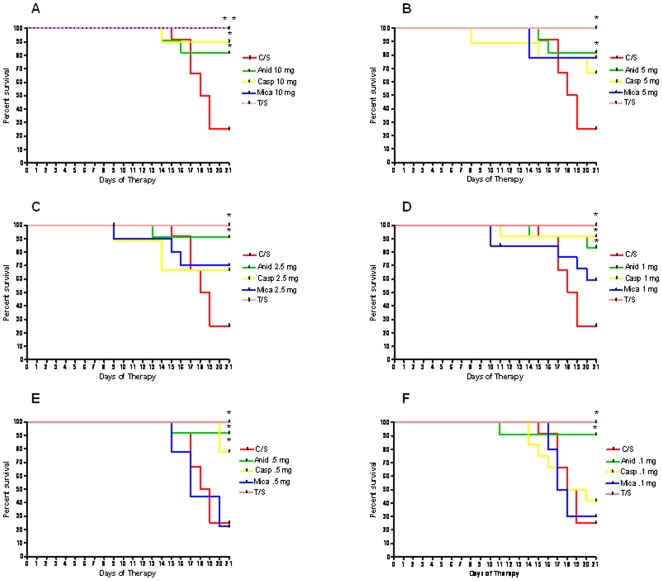
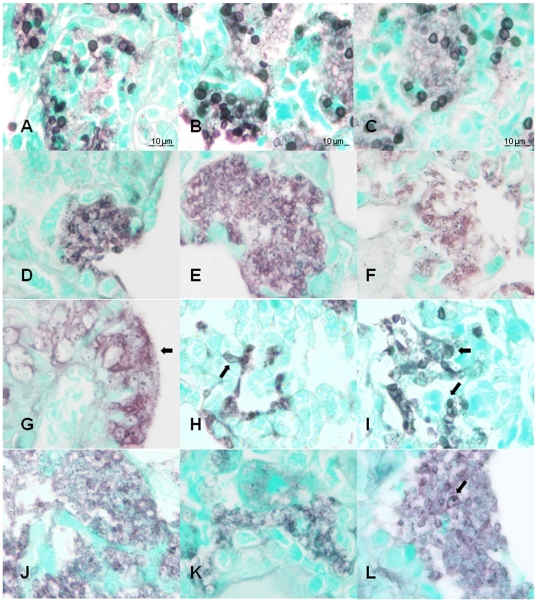
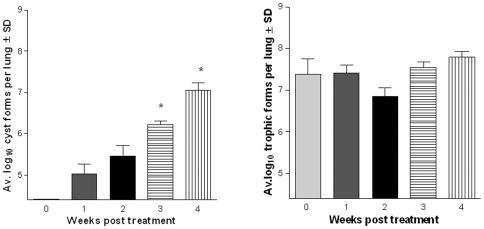
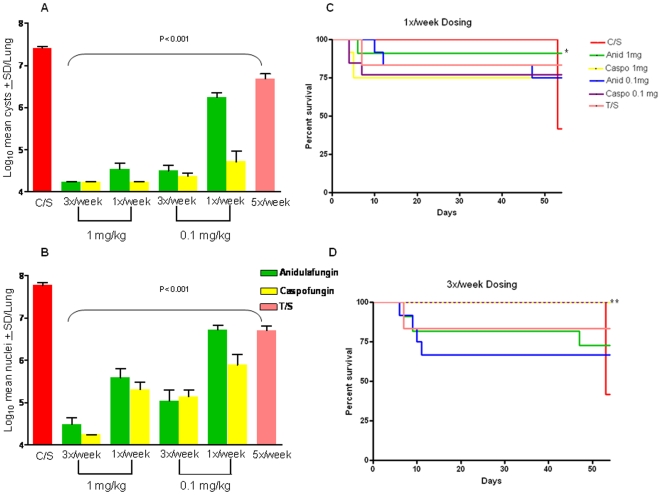
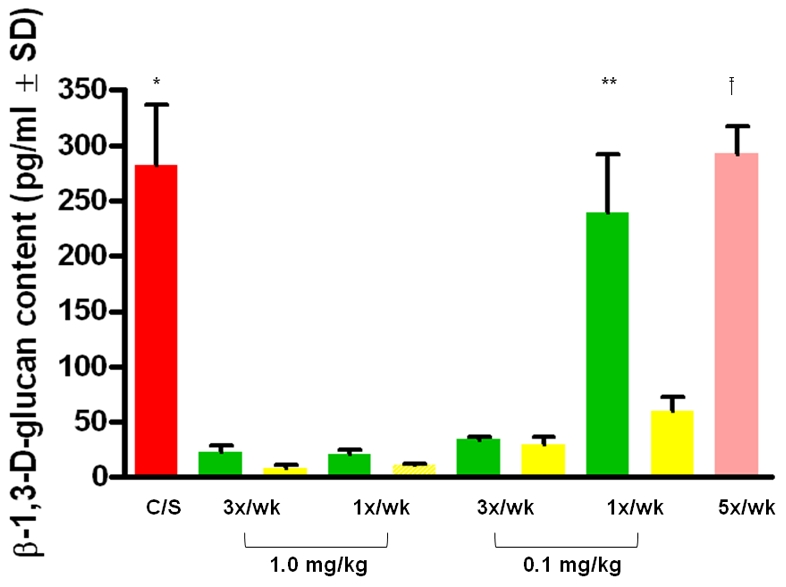
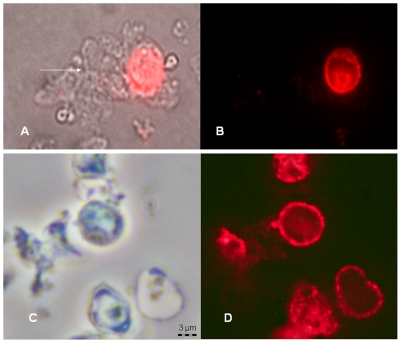
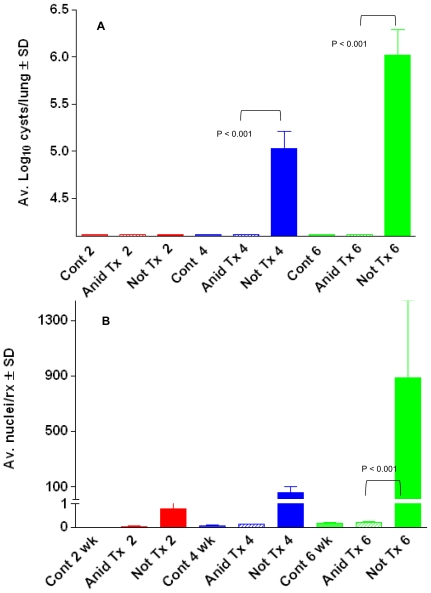
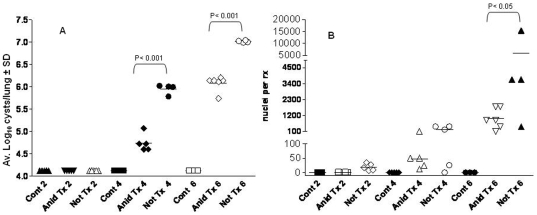
Fungi in the genus Pneumocystis cause pneumonia (PCP) in hosts with debilitated immune systems and are emerging as co-morbidity factors associated with chronic diseases such as COPD. Limited therapeutic choices and poor understanding of the life cycle are a result of the inability of these fungi to grow outside the mammalian lung. Within the alveolar lumen, Pneumocystis spp., appear to have a bi-phasic life cycle consisting of an asexual phase characterized by binary fission of trophic forms and a sexual cycle resulting in formation of cysts, but the life cycle stage that transmits the infection is not known. The cysts, but not the trophic forms, express beta -1,3-D-glucan synthetase and contain abundant beta -1,3-D-glucan. Here we show that therapeutic and prophylactic treatment of PCP with echinocandins, compounds which inhibit the synthesis of beta -1,3-D-glucan, depleted cysts in rodent models of PCP, while sparing the trophic forms which remained in significant numbers. Survival was enhanced in the echincandin treated mice, likely due to the decreased beta -1,3-D-glucan content in the lungs of treated mice and rats which coincided with reductions of cyst numbers, and dramatic remodeling of organism morphology. Strong evidence for the cyst as the agent of transmission was provided by the failure of anidulafungin-treated mice to transmit the infection. We show for the first time that withdrawal of anidulafungin treatment with continued immunosuppression permitted the repopulation of cyst forms. Treatment of PCP with an echinocandin alone will not likely result in eradication of infection and cessation of echinocandin treatment while the patient remains immunosuppressed could result in relapse. Importantly, the echinocandins provide novel and powerful chemical tools to probe the still poorly understood bi-phasic life cycle of this genus of fungal pathogens.


Conflict of interest statement

Competing Interests: The authors have declared that no competing interests exist.

Figures

Figure 1
Figure 1. Therapeutic effects of anidulafungin, caspofungin and micafungin on P. murina cysts and trophic forms.
Data in all panels represents mice treated 3 times per week for 3 weeks with anidulafungin (green bars), caspofungin (yellow bars), micafungin (blue bars) at the doses noted and trimethoprim-sulfamethoxazole at 50/200 mg/kg (pink bars, T/S) or untreated (red bars, C/S). Bars indicate log10 mean cysts±standard deviation (SD) per lung. Panel A: High dose echinocandin treatment, cyst burdens. All groups were significantly different than the untreated control mice (C/S), P<0.001. Panel B: Low dose echinocandin treatment, cyst burdens. Cyst burdens were compared to untreated controls (C/S) and P values for each group are listed on the graph; (*) indicates P<0.001. Panel C: High dose echinocandin treatment, trophic burdens *P<0.001 treated vs untreated control mice (C/S). Panel D: Low dose echinocandin treatment, trophic burdens. *P<0.001 treated vs untreated control mice.
Figure 2
Figure 2. Survival curves of mice treated therapeutically with anidulafungin, caspofungin, micafungin.
Percent survival for treated vs untreated mice was calculated for the 21 day treatment period using GraphPad Prism v.4. Asterisks indicate a significant difference from untreated controls (C/S). Line colors reflect the treatment and regimen as shown on the figure legend. Panel A: 10 mg/kg treatment regimen: anidulafungin: P = 0.02; caspofungin: P = 0.006; micafungin: P = 0.0006; T/S: 0.002. Panel B: 5 mg/kg treatment regimen: anidulafungin: P = 0.002; T/S: P = 0.02; Panel C: 2.5 mg/kg regimen: anidulafungin: P = 0.004; T/S: P = 0.002; Panel D: 1.0 mg/kg regimen: anidulafungin: P = 0.0049; caspofungin: P = 0.002; T/S: P = 0.002; Panel E: 0.5 mg/kg regimen: anidulafungin: P = 0.002; caspofungin:P = 0.007; T/S: P = 0.002; Panel F: 0.1 mg/kg regimen: anidulafungin: P = 0.004; T/S: P = 0.002.
Figure 3
Figure 3. Histological morphology of P. murina treated with caspofungin, micafungin and anidulafungin.
Grocott's methenamine silver-stained sections of lungs from: untreated mice (Panels A–C); representative sections from mice treated with 10-, 5- and 1 mg/kg caspofungin (Panels D–F;) representative sections from mice treated with 10-, 5- and 1 mg/kg micafungin (Panels G–I); and 10-, 5- and 1 mg/kg anidulafungin (Panels J–L). 1,250× magnification; 10 um bars in Panels A–C are the same for Panels D–L. Arrows indicate morphologies discussed in the text.
Figure 4
Figure 4. Cysts return after withdrawal of anidulafungin.
(Panel A) Average log cyst counts. Week 2 vs 0 wk. (*) P<0.05; Weeks 4, 6 vs 0 wk (**) P<0.001 (Panel B) Average log trophic counts. No significant differences among the groups when compared to time point “0”. Weeks 2 and 4 post treatment were significantly different (P<0.05). The biological significance of this difference is unknown.
Figure 5
Figure 5. Pneumocystis pneumonia and survival curves of mice treated prophylactically with anidulafungin and caspofungin.
Mice received prophylactic anidulafungin (green bars) and caspofungin (yellow bars) at doses at the dose regimens indicated on the figure legends. Trimethoprim-sulfamethoxazole (T/S) was given at the lower prophylactic dose of at 12.5/62.5 mg/kg. Bars indicate log10 mean cyst forms±SD/lung. Panel A: Log10 mean cyst counts of 1.0 and 0. 1 mg/kg caspofungin and anidulafungin. All treatment regimens were significantly different than untreated control mice (*P<0.001). Panel B: Log10 mean trophic counts of 1.0 and 0. 1 mg/kg caspofungin and anidulafungin. All treatment regimens were significantly different than untreated control mice (*P<0.001). Panel C: Survival curves of mice that received 1 mg/kg of anidulafungin and caspofungin once per week. 1X/week dosing: anidulafungin, 1 mg/kg: P = 0.03. Panel D: Survival curves of mice that received 1 mg/kg of anidulafungin and caspofungin thrice per week. Significance for 3X/week dosing: caspofungin, 1 mg/kg: P = 0.002; caspofungin, 0.1 mg/kg: P = 0.002.
Figure 6
Figure 6. β-1,3-D-glucan in the lungs of mice treated prophylactically with echinocandins.
β-1,3-D-glucan contents in the lungs of treated and untreated mice and rats were quantified with the GLUCATELL™ kit. Red bar (C/S) = untreated, immunosuppressed mice; Green bars = anidulafungin; Yellow bars = caspofungin; Pink bar = prophylactic dose of TMP/SMX (12.5/62.5 mg/kg). Dose regimens are described on the X-axis. (*) The average of the untreated mouse group was statistically different (P<0.001) from all groups treated prophylactically except anidulafungin 0.1 mg/kg/1x/wk and the TMP/SMX prophylactically -treated mice. (**)The average of the mice prophylactically treated with anidulafungin 0.1 mg/kg/1x/wk was statistically different from all of the echinocandin-treated mouse groups (P<0.001) but not from the TMP/SMX treated or the untreated mice. () The mice treated prophylactically with TMP/SMX treated were significantly different from all of the echinocandin-treated mice except for anidulafungin 0.1 mg/kg/1x/wk and the untreated control group (P<0.001).
Figure 7
Figure 7. Effects of anidulafungin on β-1,3-D-glucan in P. carinii.
P. carinii from the lungs of immunosuppressed rats were treated with 60 µg/ml anidulafungin for 24 hrs and reacted with a mAB to β-1,3-D-glucan conjugated to Alexafluor 594. Panel A: Non-anidulafungin treated P. carinii viewed by phase microsocopy showing a cluster of trophs (arrow) attached to a cyst; Panel B: the same cluster viewed by fluorescent microscopy; no trophs were stained by the antibody; Panel C: Anidulafungin-treated P. carinii viewed by phase contrast microscopy; and Panel D: the same cluster under fluorescent excitation. Note the punctate staining pattern in both samples. All panels magnified according to the bar in Panel C.
Figure 8
Figure 8. Anidulafungin-treated mice cannot transmit Pneumocystis infection.
Panel A: Average cyst counts of mice exposed to untreated infected mice (Not treated, “Not Tx”) or anidulafungin treated (“Anid Tx”) mice and immunosuppressed for 2, 4 and 6 wks. “Controls” were non-exposed, immunosuppressed mice (“Cont”). Panel B: P. murina mtLSU message was detected by RT-qPCR and expressed as nuclei/reaction.
Figure 9
Figure 9. Intranasal inoculation of P. murina from anidulafungin treated mice cause infection and are viable.
Panel A: Average log10 cysts in the lungs of immunosuppressed mice intranasally inoculated with anidulafungin treated or non-treated organisms. Not Tx = non-treated; Anid Tx = anidulafungin treated P. murina. 2-, 4-, 6 wks immunosuppression; Cont = immunosuppressed uninoculated mice. Panel B: RT-qPCR of immunosuppressed mice inoculated with anidulafungin-treated or non-treated P. murina. Legend as in Panel A. Significant differences between groups are shown on the figure.

References

    1. Beck JM, Cushion MT. Pneumocystis workshop: 10th anniversary summary. Eukaryot Cell. 2009;8:446–60. - PMC - PubMed
    1. Thomas CF, Jr, Limper AH. Current insights into the biology and pathogenesis of Pneumocystis pneumonia. Nat Rev Microbiol. 2007;5:298–308. - PubMed
    1. Cushion MT, Smulian AG, Slaven BE, Sesterhenn T, Arnold J, et al. Transcriptome of Pneumocystis carinii during fulminate infection: carbohydrate metabolism and the concept of a compatible parasite. PLoS ONE. 2007;2:e423. - PMC - PubMed
    1. Vohra PK, Park JG, Sanyal B, Thomas CF., Jr Expression analysis of PCSTE3, a putative pheromone receptor from the lung pathogenic fungus Pneumocystis carinii. Biochem Biophys Res Commun. 2004;319:193–9. - PubMed
    1. Icenhour CR, Rebholz SL, Collins MS, Cushion MT. Early acquisition of Pneumocystis carinii in neonatal rats as evidenced by PCR and oral swabs. Eukaryot Cell. 2002;1:414–9. - PMC - PubMed

Publication types